HelpDesk
How To Make Chen ER Diagram
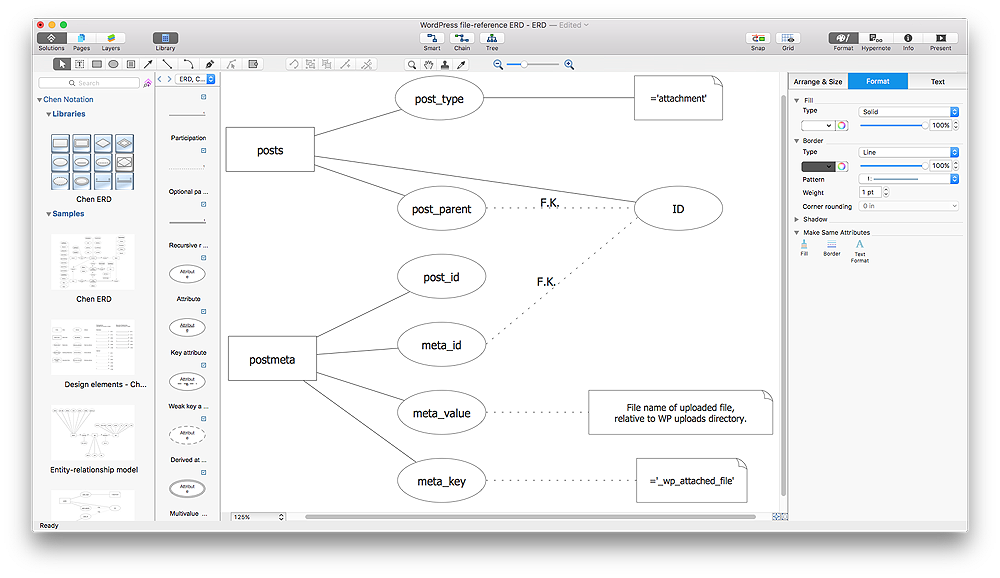
The Chen ERD notation model is a popular standard and is widely used worldwide in database and software design. The entity-relationship model proposed by Dr. Chen is constructed using a natural view of how the real world comprises entities and the relationships that exist with these identified entities. It was designed to leverage the advantages of the three entity-data models (network model, relationship model, entity model). The free Chen Notation solution for ConceptDraw PRO provides vector stencil libraries with full standardized Chen notation included.HelpDesk
How to Add a Bubble Diagram to a MS Word Document Using ConceptDraw PRO
A bubble chart is a diagram in which the data points are replaced with bubbles, and the size of the bubbles represents some additional dimension of the data. A bubble chart does not have the axis. A bubble chart can be used instead of a scatter diagram if the data has three dimensions, each of that containing the set of values. The sizes of the bubbles are determined by the values in the third dimension. Any additional information about the entities beyond their three primary dimensions can be depicted by rendering bubbles in colors and patterns that are selected in a certain way. The legend containing the further information can be added to a bubble diagram. ConceptDraw PRO allows you to easily create various business management and marketing charts, including bubble diagrams and then add them to a MS Word document.
 Entity-Relationship Diagram (ERD)
An Entity-Relationship Diagram (ERD) is a visual presentation of entities and relationships. That type of diagrams is often used in the semi-structured or unstructured data in databases and information systems. At first glance ERD is similar to a flowch
HelpDesk
How to Add a Concept Map to a MS Word Document Using ConceptDraw PRO
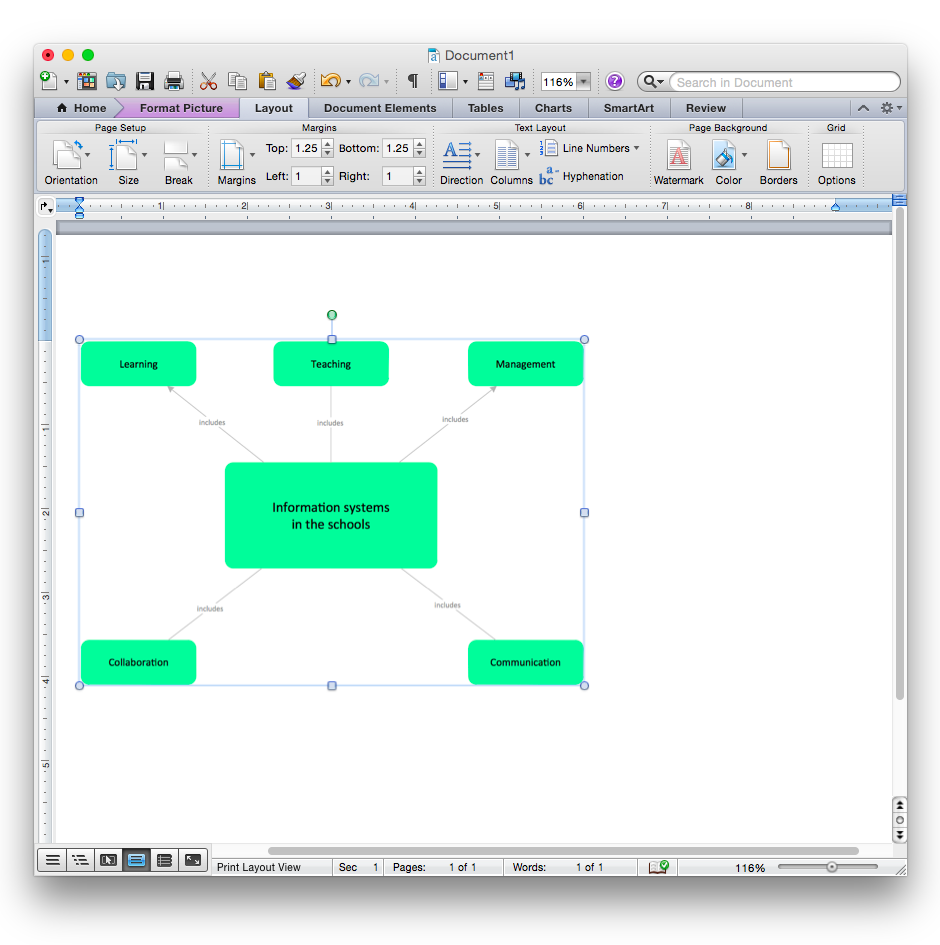
ConceptDraw PRO allows you to easily create concept maps and then insert them into a MS Word document.
 Entity-Relationship Diagram (ERD)
Entity-Relationship Diagram (ERD) solution extends ConceptDraw PRO software with templates, samples and libraries of vector stencils from drawing the ER-diagrams by Chen's and crow’s foot notations.
 Word Exchange
This solution extends ConceptDraw MINDMAP software with the ability to quickly create the framework for a future article or book, fill the structure with ideas, and use it to produce an MS Word document with just a simple click of the mouse.
 Circle-Spoke Diagrams
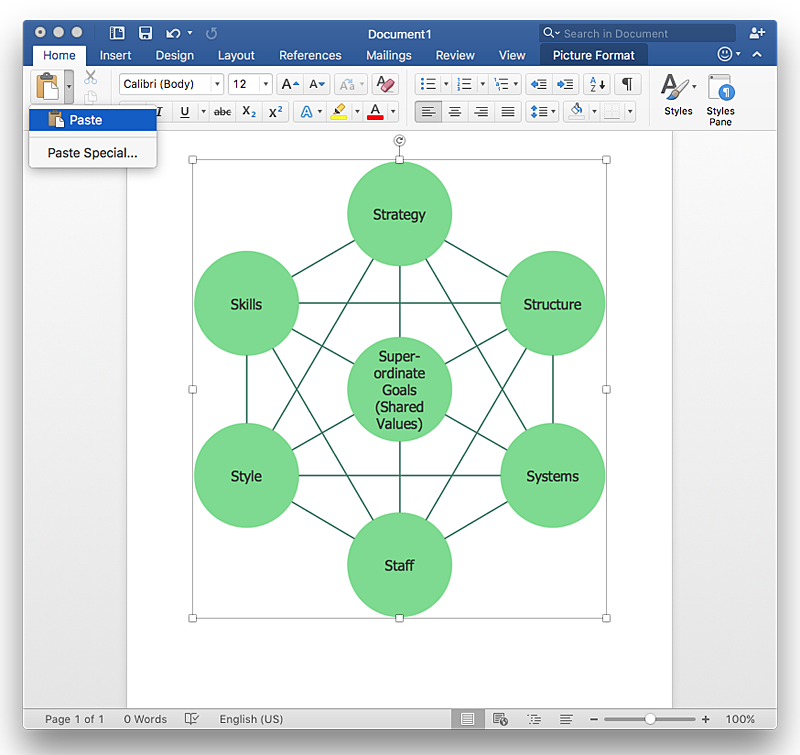
Examples of subject areas that are well suited to this approach are marketing, business, products promotion, process modeling, market, resource, time, and cost analysis. Circle-Spoke Diagrams are successfully used in presentations, conferences, management documents, magazines, reportages, reviews, reports, TV, and social media.
- Draw An Er Diagram Using Word
- How To Draw Entity Relationship Diagrams On Ms Word
- How To Draw Entity Relationship Diagram In Microsoft Word
- How To Make Erd Diagram In Word
- How To Draw Crows Foot Erd In Word
- Entity Relationship Diagram In Word
- How To Make An Er Diagram In Word
- How To Draw Architectural Diagram And ER Diagram In Ms Word
- How To Draw Er Diagram In Ms Powerpoint
- How To Do Er Diagram In Microsoft Word
- How To Draw Erd Diagram In Microsoft Word
- How To Draw Erd In Word
- How to Add a Bubble Diagram to a MS Word Document Using ...
- Draw Erd In Word
- How To Draw Er Diagram In Microsoft Word
- What Tool Should I Use To Draw Erd In Word
- Erd Diagram For Library Management For Word File
- Er Diagram Microsoft Word
- How To Draw Block Diagram In Word
- How to Draw ER Diagrams | Entity Relationship Diagram Symbols ...


