HelpDesk
How to Draw a Chemical Process Flow Diagram
Process Flow Diagram widely used in modeling of processes in the chemical industry. A Chemical Process Flow diagram (PFD) is a specialized type of flowchart. With the help of Chemical Process Flow Diagram engineers can easily specify the general scheme of the processes and chemical plant equipment. Chemical Process Flow Diagram displays the real scheme of the chemical process, the relationship between the equipment and the technical characteristics of the process. Chemical Process Flow Diagram illustrates the connections between the basic equipment as well as the overall structure of pipelines and other supporting equipment. The purpose of the PFD is to build the image of the basic idea of the chemical process. ConceptDraw PRO together with its Chemical and Process Engineering solution delivers the possibility to design Chemical Process Flow diagrams. It is designed for chemical industry engineers and designers.HelpDesk
How to Make Network Diagram
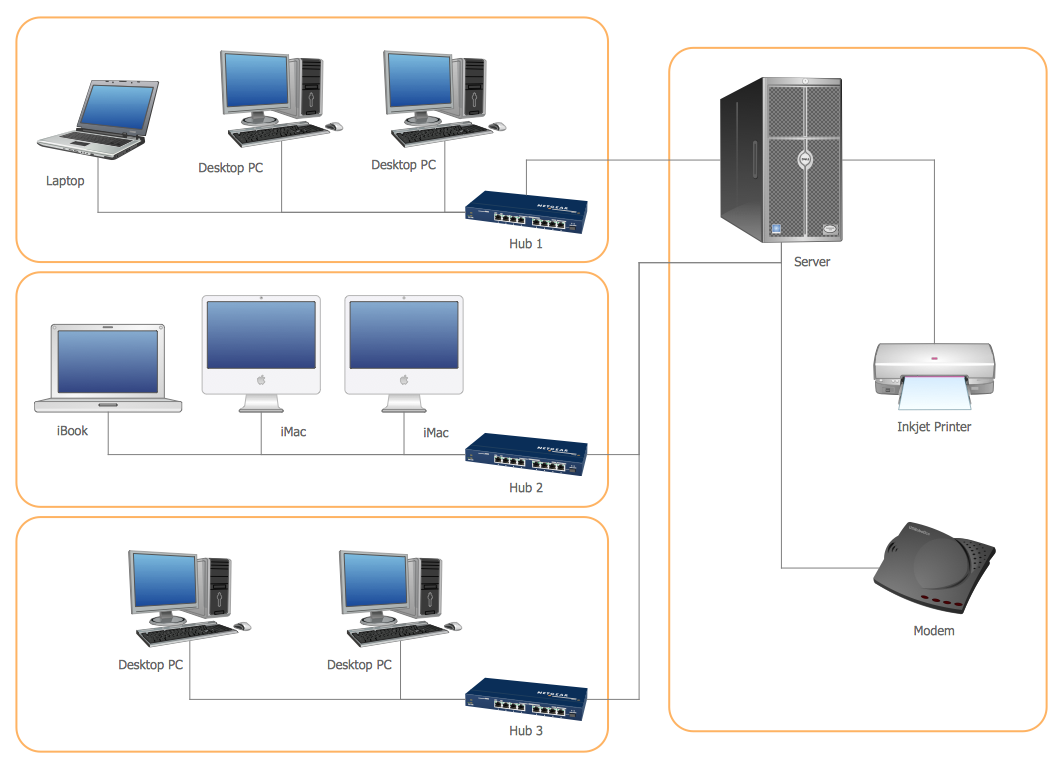
ConceptDraw PRO allows you to represent and communicate network architecture, topology, and design to engineers, stakeholders and end-users.HelpDesk
How To Convert a Concept Map to Adobe PDF Using ConceptDraw PRO
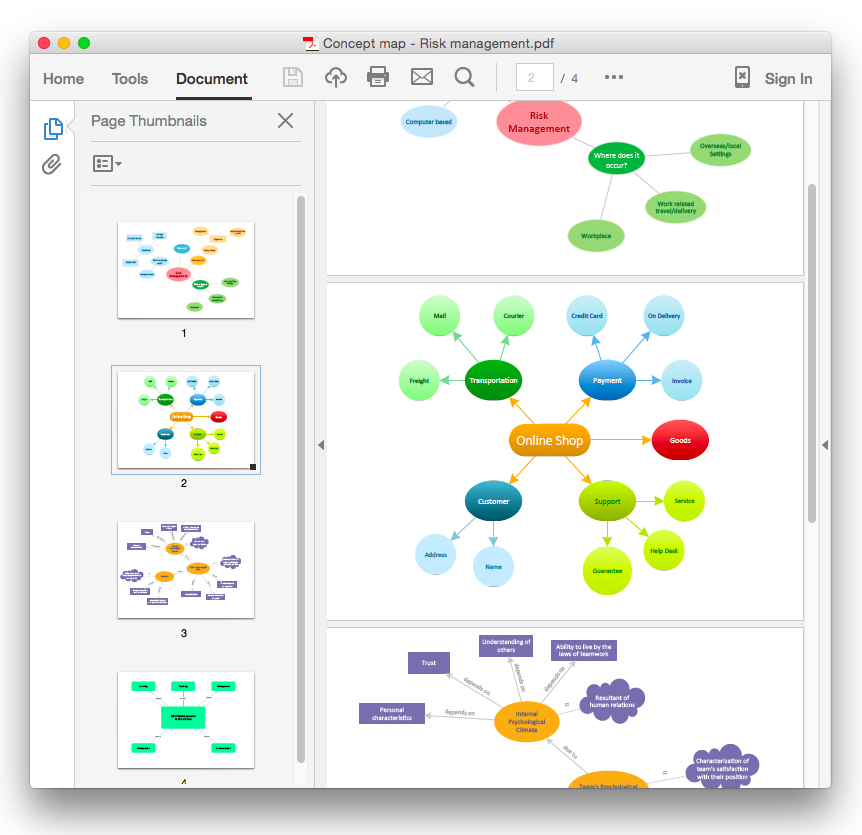
ConceptDraw PRO allows you to easy share your concept maps between different computers with different operating systems and applications using it's export capabilities.You can get clear business graphic pack in pdf format and easily communicate it with stakeholders.HelpDesk
How to Create Cisco Network Diagrams
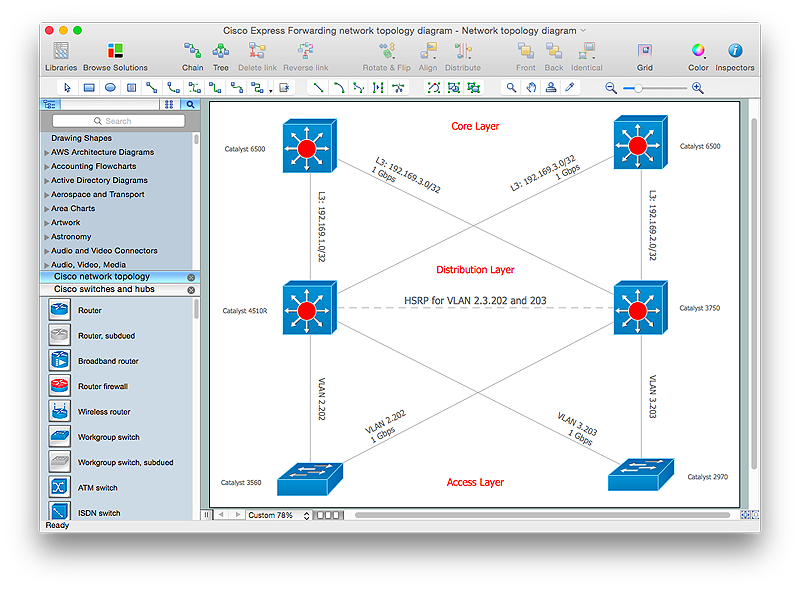
The easiest way to design Cisco Network diagram using standard Cisco product symbols is using ConceptDraw PRO powered by Cisco Network Diagrams solution. The Cisco Network Diagrams solution uses Cisco network symbols to to visually document the topology and design of Cisco networks.HelpDesk
How to Create a Rack Diagram in ConceptDraw PRO
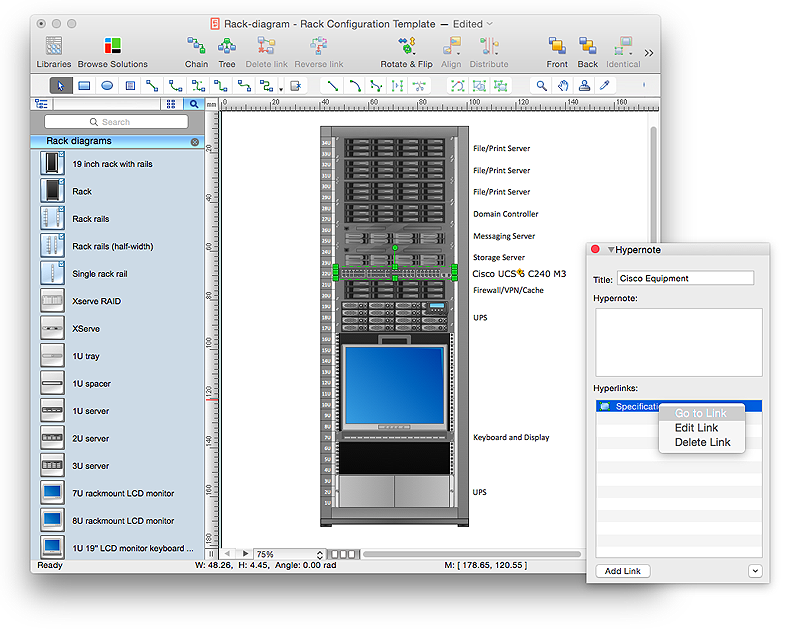
A Rack Diagram represents the rack mounting of network and computer equipment that is installed as a server. Rack diagrams are used by system administrators and network architectors when making a decision regarding the purchase of network equipment. It is used to show how a particular server configuration can be composed, without making its physical installation. ConceptDraw PRO enhanced with the Rack Diagrams Solution can be successfully used for making various rack diagrams. It's important that the solution used to create a rack diagram contains templates that stick to industry standards, and supplies a big selection of device icons to cover multiple types of equipment for a number of network configurations.HelpDesk
How to Create a Bubble Diagram Using ConceptDraw PRO
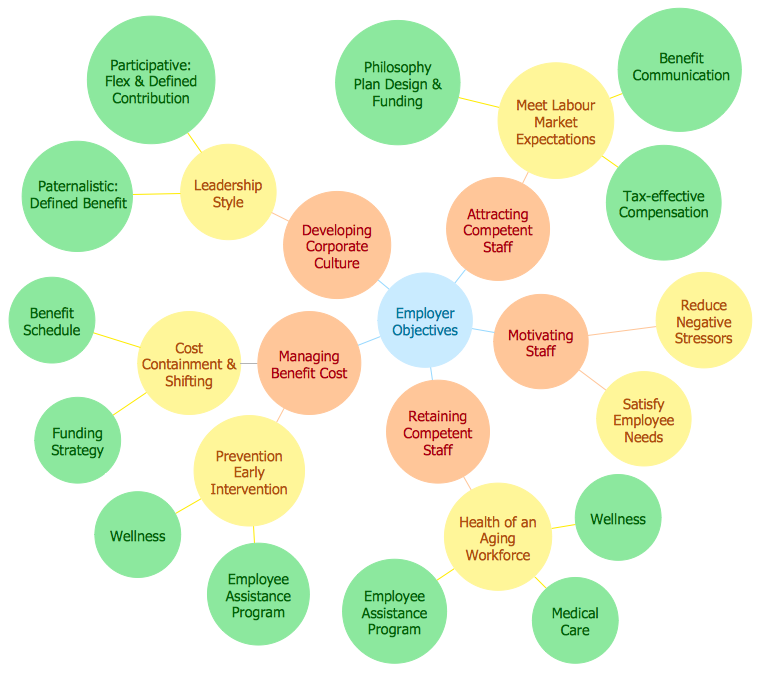
Bubble Diagram is a simple chart that consists of circles (bubbles) repesening certain topics or processes. Bubbles are connected by lines depicting the type of relationships between the bubbles. The size of each bubble is depended on the importance of the entity it represents. Bubble charts are widely used throughout social, economical, medical, and other scientific researches as well as throughout architecture and business management. Bubble charts are often used during the early stages of product development to visualize thoughts and ideas for the purpose of sketching out a development plan. ConceptDraw PRO allows you to draw a bubble diagrams using the Bubble Diagrams solution.HelpDesk
How to Create a Wireless Network Diagram
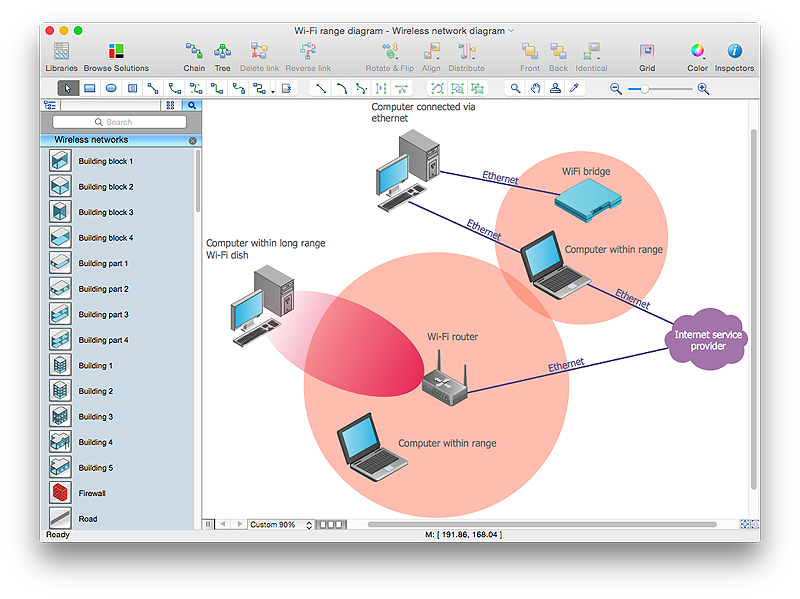
A wireless network diagram is a specialized type of computer network diagrams. Wireless Network diagrams are used to develop, operate and maintain the WLAN systems. Making a Wireless Network diagram involves many different elements that can be managed using ConceptDraw PRO. With ConceptDraw PRO you can easily create and communicate the Wireless Network diagram of any complexity.- How To Convert a Computer Network Diagram to Adobe PDF Using ...
- How To Convert a Computer Network Diagram to Adobe PDF Using ...
- How To Convert a Rack Diagram to Adobe PDF Using ConceptDraw ...
- How To Convert a Computer Network Diagram to Adobe PDF Using ...
- Telecommunication Network Diagrams | How To Create a MS Visio ...
- How To Create CCTV Network Diagram
- Network Icon | ConceptDraw PRO Network Diagram Tool | How to ...
- Wireless Networks | How to Create a Wireless Network Diagram ...
- How To Convert a Computer Network Diagram to Adobe PDF Using ...
- Telecommunication Network Diagrams | Telecommunication ...
- Computer Network Diagrams | How to Draw a Computer Network ...
- Network Diagram Of A Company In Pdf
- Lan Wiring Diagram For Lan Network Pdf
- Computer Network Diagrams | How to Draw a Computer Network ...
- How To Create CCTV Network Diagram | How to Create a CCTV ...
- How to Create a CCTV Diagram in ConceptDraw PRO | CCTV ...
- Connect The Computer In Lans Free Pdf With Daigram
- How to Create a Wireless Network Diagram | How to Add a Wireless ...
- Computer Network Diagrams | Computer and Networks Area ...
- Network Layout Floor Plans | Computer Network Diagrams | Star ...

