 Accounting Flowcharts
Accounting Flowcharts solution extends ConceptDraw PRO software with templates, samples and library of vector stencils for drawing the accounting flow charts.
Process Flowchart
The main reason of using Process Flowchart or PFD is to show relations between major parts of the system. Process Flowcharts are used in process engineering and chemical industry where there is a requirement of depicting relationships between major components only and not include minor parts. Process Flowcharts for single unit or multiple units differ in their structure and implementation. ConceptDraw PRO is Professional business process mapping software for making Process flowcharts, Process flow diagram, Workflow diagram, flowcharts and technical illustrations for business documents and also comprehensive visio for mac application. Easier define and document basic work and data flows, financial, production and quality management processes to increase efficiency of your business with ConcepDraw PRO. Business process mapping software with Flowchart Maker ConceptDraw PRO includes extensive drawing tools, rich examples and templates, process flowchart symbols and shape libraries, smart connectors that allow you create the flowcharts of complex processes, process flow diagrams, procedures and information exchange. Process Flowchart Solution is project management workflow tools which is part ConceptDraw Project marketing project management software. Drawing charts, diagrams, and network layouts has long been the monopoly of Microsoft Visio, making Mac users to struggle when needing such visio alternative like visio for mac, it requires only to view features, make a minor edit to, or print a diagram or chart. Thankfully to MS Visio alternative like ConceptDraw PRO software, this is cross-platform charting and business process management tool, now visio alternative for making sort of visio diagram is not a problem anymore however many people still name it business process visio tools.
Best Flowchart Software and Flowchart Symbols
For many years ConceptDraw Solution Park delivers a great quantity of high-quality business process flowchart and flow diagram solutions, which are turned the ConceptDraw PRO into the most comprehensive and powerful software. Now it is an example of the best professional flowchart software available with extensive set of solutions, including the Flowcharts solution. The ConceptDraw solutions contain thousands of standard basic and creative flowchart symbols and other design elements, numerous quick-start templates, samples and examples. ConceptDraw PRO diagramming and vector graphics software includes specific drawing tools that you need to easily design the flowcharts and diagrams of any complexity and degree of detailing. Use ConceptDraw PRO to draw your own diagrams, charts, graphs and flowcharts for graphic communication, simple visual presentation of complex structures, numerical data and logical relations, explanation business and personal ideas and concepts, representation step-by-step flows of actions or operations, etc.Flowchart Software
Flowchart is a simple diagram, map or graphical schematic representation the sequence of actions within a process. It is ideal for displaying how a process currently flows or can function ideally. The Flowcharts let define the steps and boundaries of a process, uncover problems or miscommunications. The Flowcharts are widely used in education, software development, business, economics, thanks to their visuality they are ideal for presentations, reports, for using on conferences to help the audience comprehend the content better, or easy find flaws in a process flow diagrams. ConceptDraw PRO is professional flowcharts software and feature-rich flowchart maker, which supports Mac OS X and Windows. It contains at ConceptDraw Solution Park a rich set of stencils and professional flowchart symbols for design. It lets create simply professional-looking Flowcharts based on thousand free flowchart templates, colored symbols and examples. ConceptDraw PRO is a 3 times cheaper alternative to MS Visio available for both Mac and PC. It’s is another full featured business and technical diagramming application that can easily take care of Visio files within OS X. Another bonus with ConceptDraw PRO – it's cross-platform. You can work on a document in both OS X and Windows, skipping Visio entirely.
Visual Presentations Made Easy with Diagramming Software
Automatically create a presentation-quality diagram in one click with ConceptDraw PRO.
Social Media Response Management DFD Charts - software tools
ConceptDraw is your tool for driving social integration and managing change across and streamline social media processes of your organisation.This tool keeps the entire team on the same page allowing you to realize your social media strategy, improve the quality of your answers, and minimize the time it takes to respond.
HelpDesk
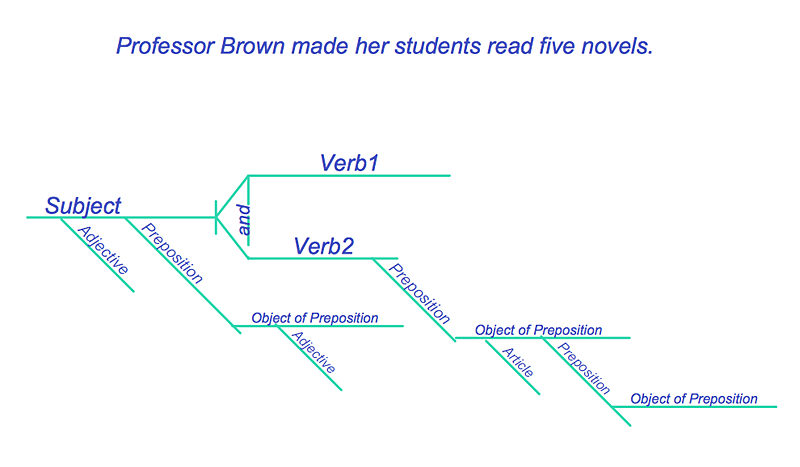
How to Diagram Sentences in ConceptDraw PRO
Diagramming sentences is a playful, fun way to learning English Grammer. Sentences can be very complex, and can contain many different parts of speech which implicate many different grammatical rules. Diagramming sentences will help you to make sure every parts of your sentence are grammatically correct, and provides you with more comprehensive understanding of the English Language. A Sentence Diagram displays the parts of a sentence as a diagram in order to show the relationship of words and groups of words within the sentence. Sentence Diagram shows the relationship between the proposal of its parts. This is a good way to teach grammar! Sentence Diagram helps to make the writing more coherent as well as more interesting to read. ConceptDraw PRO allows you to create clear sentence diagrams using the special templates and vector stencils library.Value Stream Mapping Icons
The library with 40 vector stencils is included in the ConceptDraw Value Stream Mapping solution.What is a Quality Management
Successful quality management implemented in a company of any size is a critical component of a company organization.Basic Flowchart Examples
ConceptDraw PRO is a business flowchart software includes the wide flowchart examples package.Best Vector Drawing Application for Mac OS X
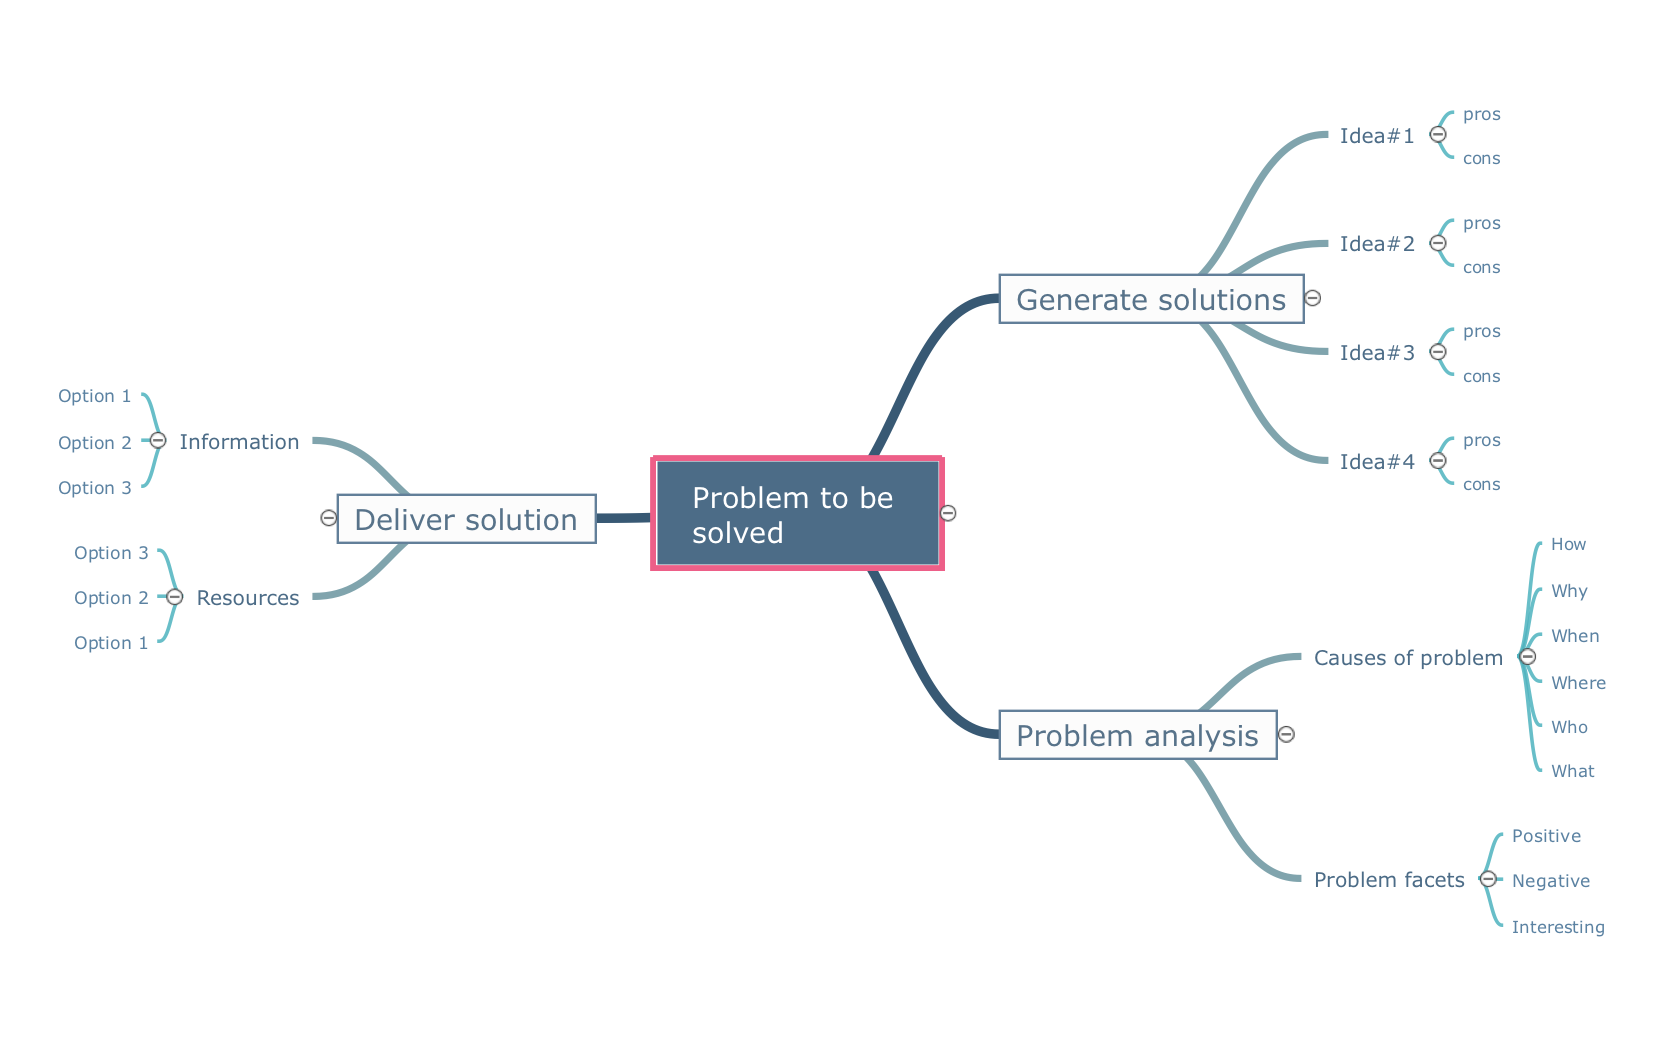
ConceptDraw PRO creates drawings, diagrams and charts with great visual appeal in Mac OS X.Learning with MindMap
Mind Maps are the simplest way to organize your ideas and information, that's why they are very popular in almost all areas of life and activity, particularly in education area. Learning with Mind Maps is easy, interesting and effective, they help lecturers and teachers to keep the attention of students, to make their lectures relevant and interesting. ConceptDraw MINDMAP 7 is an ideal software for the learning process. It contains great tools for all activities from the organizing to accomplishing the learning process. These tools will help you easy design the learning MindMaps, prepare different learning materials, lectures and lessons plans, make presentations and comprehensive visual illustrations that will provide better understanding and memorizing of new material by the students, provide trainings and brainstorming for effectively collecting and organizing ideas. Mind Maps are also useful and effective in self learning and organizing the distance learning for the team, they help in problem solving, in testing knowledge of students, and much more.Best Diagramming
Need to draw a diagram, process chart, flowchart, organizational chart, graphic design? ConceptDraw can help you to make professional graphic documents quickly.
Create Graphs and Charts
Charting Software allows you to create diagrams, charts, graphs, flowcharts, and other business graphics. ConceptDraw PRO include simple shape drawing tools, examples, templates, and symbol libraries.- Value Stream Mapping Icons | Basic Flowchart Symbols and ...
- Process Flowchart | Basic Flowchart Symbols and Meaning | Flow ...
- Basic Flowchart Symbols and Meaning | Value Stream Mapping ...
- Basic Flowchart Symbols and Meaning | Flowchart design ...
- Process Flowchart | Basic Flowchart Symbols and Meaning | Cross ...
- Process Flowchart | Basic Flowchart Symbols and Meaning | Types ...
- Cross-Functional Flowcharts | How to draw a Cross-Functional ...
- Flowcharts | Flowchart Software | Mathematics | School ...
- How to Draw Biology Diagram in ConceptDraw PRO | Biology | Bio ...
- Process Flowchart | Piping and Instrumentation Diagram Software ...
- Basic Flowchart Symbols and Meaning | ConceptDraw Solution Park ...
- Basic Flowchart Symbols and Meaning | Flowchart design ...
- Cross-Functional Flowcharts | Types of Flowchart - Overview | How ...
- Cross Functional Flowchart In Mac
- Entity Relationship Diagram Symbols and Meaning ERD Symbols ...
- What is a Cross Functional Flow Chart ? | Accounting Flowcharts ...
- How to Create a Cross Functional Flow Chart | Basic Flowchart ...
- HR management process - Flowchart | Process Flowchart | How to ...
- Process Flowchart | How To use House Electrical Plan Software ...
- Business Diagram Software | Cross-Functional Flowchart ...


