Cisco Network Templates
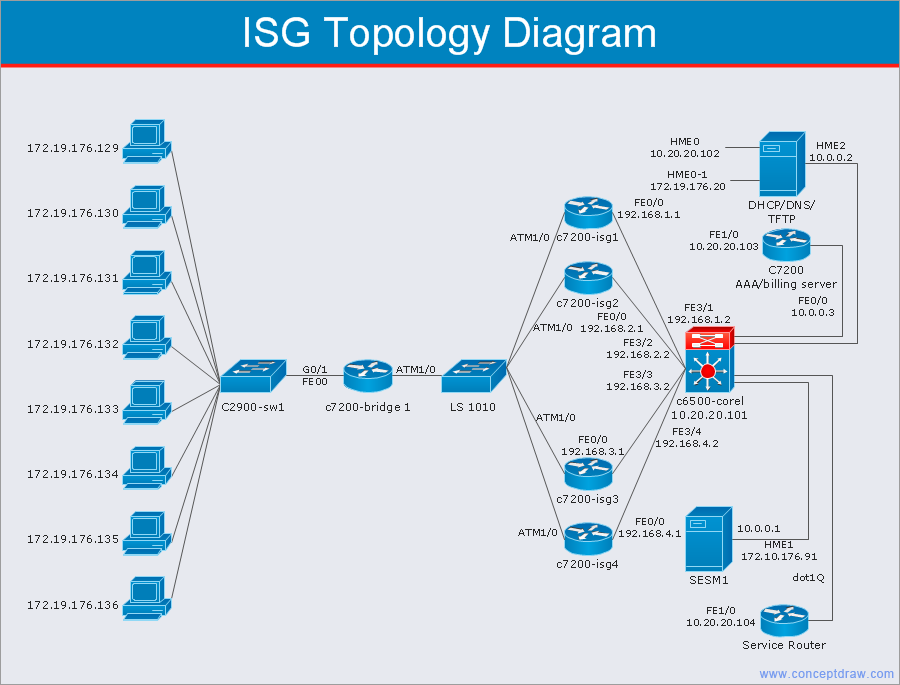
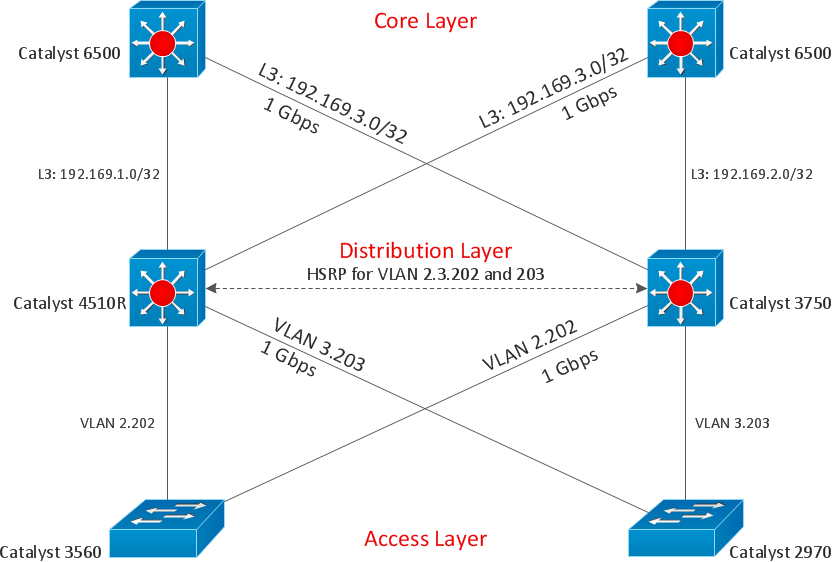
Cisco is a huge multinational company that develops and sells worldwide the]network equipment, mainly for large organizations and telecommunication companies. So, it has large number of enterprise clients in a corporate environment. Therefore many network engineers often draw the Network diagrams for Cisco hardware and are needed in a powerful vector drawing software. ConceptDraw DIAGRAM is ideal for this goal, enhanced with professional Cisco Network Diagrams solution from Computer and Networks area of ConceptDraw Solution Park it offers a wide variety of vector design objects libraries, samples and also large set of Cisco network templates. The use of templates is the easiest and time-saving way of drawing professional-looking diagrams and schematics. Use them to design Cisco Network Topologies, Cisco Network Diagrams, Cisco ISG Topology Diagrams, Cisco Express Forwarding Diagrams, Rack Diagrams, Network Organization Charts, Wireless Computer Network Diagrams, Vehicular Network Diagrams, and many other types of diagrams without efforts.
 Basic Area Charts
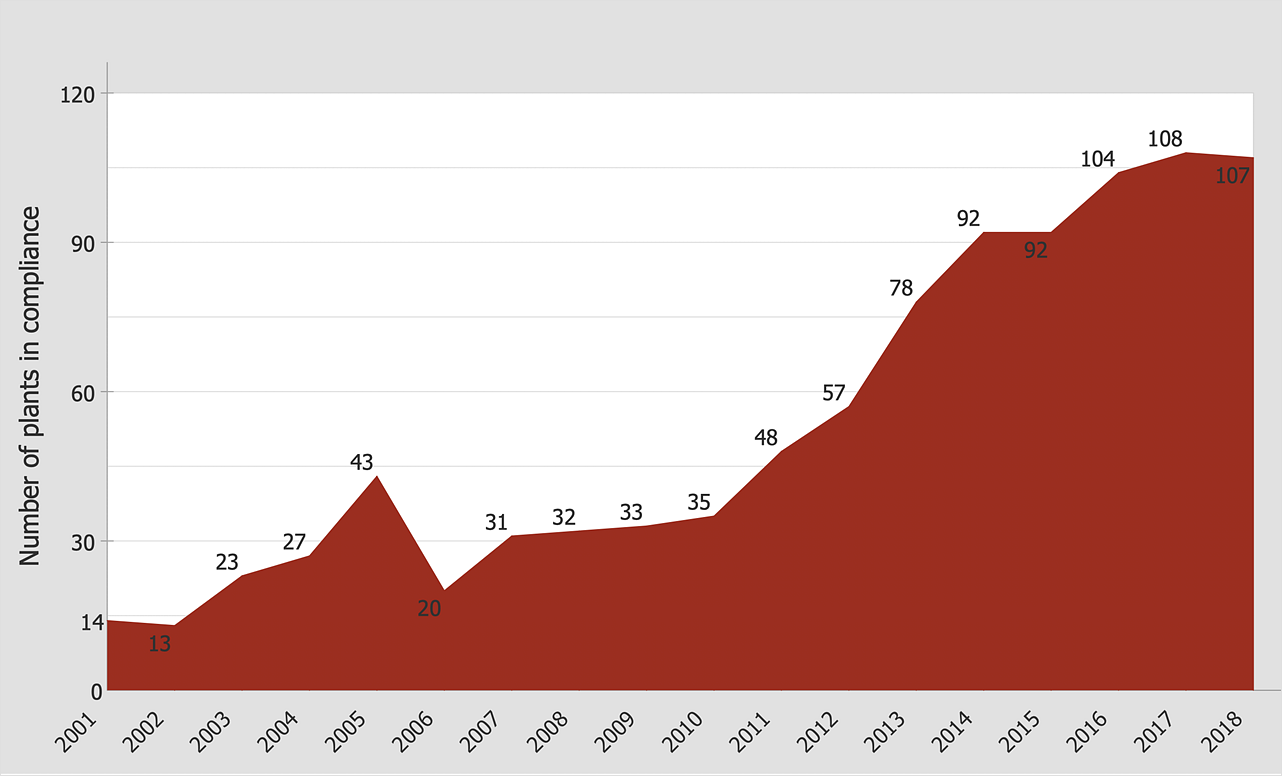
This solution extends the capabilities of ConceptDraw DIAGRAM (or later) with templates, samples and a library of vector stencils for drawing Area Charts (area graphs) that visualize changes in values by filling in the area beneath the line connecting data points.
Network Diagram Software Backbone Network
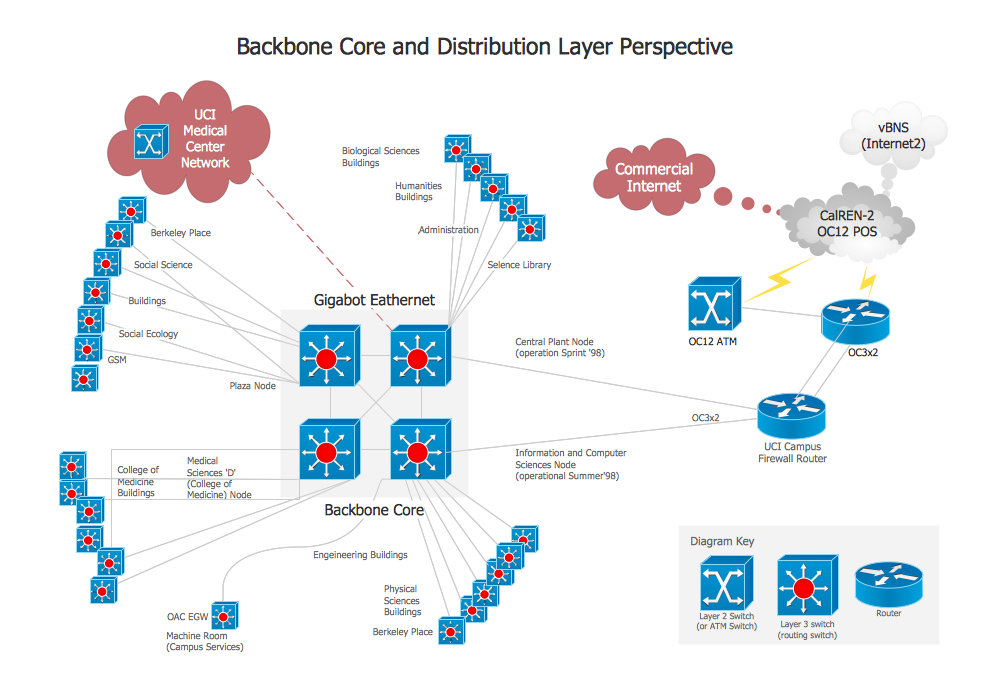
ConceptDraw - Perfect Network Diagramming Software with examples of Backbone Network Diagrams. ConceptDraw Network Diagram is ideal for network engineers and network designers who need to draw Backbone Network diagrams.
Draw Diagram on Mac
Professional diagramming software for mac helps you create Cause and Effect diagram known as Fishbone diagram or Ishikawa diagram from ConceptDraw Business Solution. You will be offered to use templates, samples or draw your diagram using ConceptDraw Arrows10 TechnologyHelpDesk
How to Draw an Area Chart
An area chart is similar to a line chart, but an area chart has an area, commonly filled with color below the line. The applying of Line charts and area charts are also very similar. They both show continuity across a data set. They are both can be used for displaying time series data and for depicting tendencies better than separate values, but they have some different characteristics. Using the proper one is good chance to show once again professionalism of your graphics documents. An area chart depicts a colored area below the line. The sum on the vertical axis of an area chart represents the entire value, while the height of each separate piece shows its parts. Area charts are used to display multiple data series with proportion to a whole value, or for separate data series showing a set of countable values, or cumulative data.- How To Make A Chart Paper On Network In Computer
- Local area network (LAN). Computer and Network Examples ...
- Make A Chart On Wan Network
- Chart On Computer Networks
- How To Create A Perfect Network Chart
- Local area network (LAN). Computer and Network Examples ...
- How to Draw a Computer Network Diagrams | Personal area (PAN ...
- Local area network (LAN). Computer and Network Examples ...
- Local area network (LAN). Computer and Network Examples ...
- Flow Chart Of Geographical Area Network
- Local area network (LAN). Computer and Network Examples ...
- Computer and Network Examples | Make A Chart Topic On Internet
- Wide area network (WAN) topology. Computer and Network ...
- How to Draw an Organization Chart | Local area network (LAN ...
- PM Easy | Gantt chart examples | Local area network (LAN ...
- Network Layout Floor Plans | Campus Area Networks (CAN ...
- Make A Chart Network Hardware Devices
- Network organization chart | Local area network (LAN). Computer ...
- Wide area network (WAN) topology. Computer and Network Examples
- Local area network (LAN). Computer and Network Examples ...


