HelpDesk
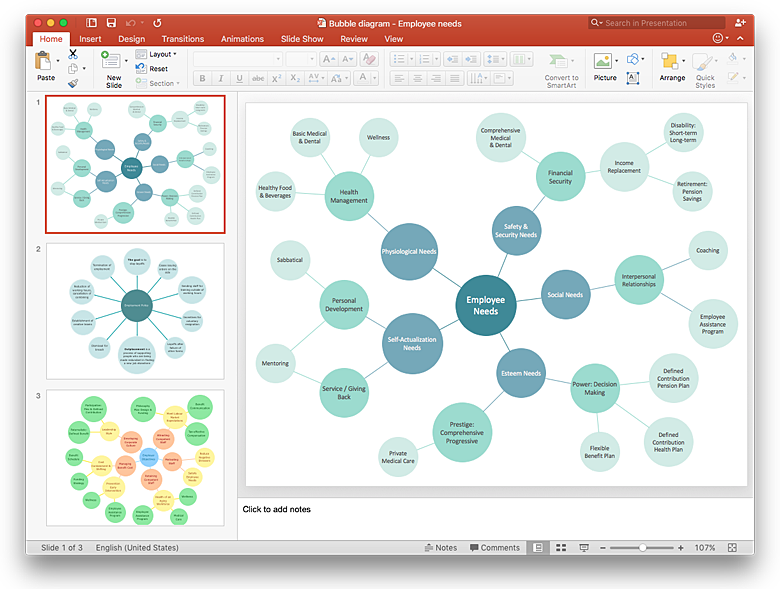
How to Add a Bubble Diagram to a PowerPoint Presentation Using ConceptDraw PRO
Bubble diagrams can be used to compare concepts, and identify areas of similarity and difference. ConceptDraw PRO allows you to make a MS PowerPoint Presentation from your charts in a few simple steps.HelpDesk
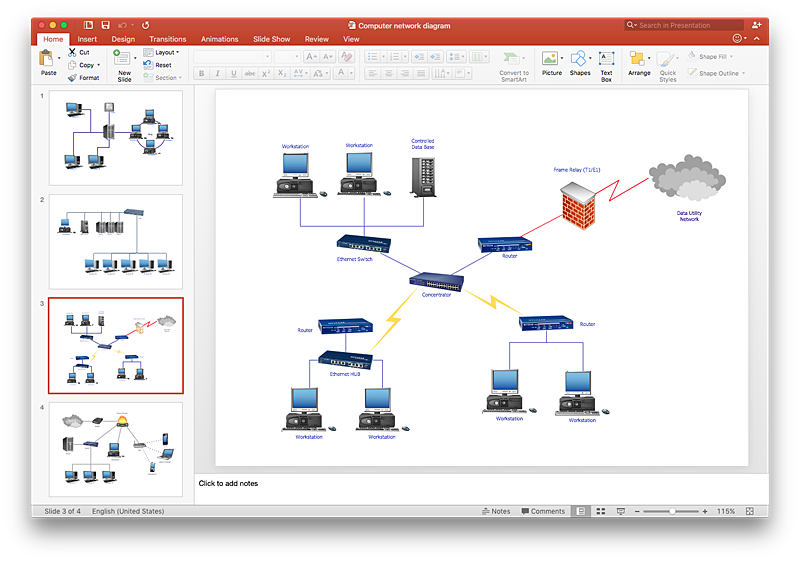
How To Add a Computer Network Diagram to a PowerPoint Presentation Using ConceptDraw PRO
The PowerPoint presentation of computer network can be very informative. ConceptDraw PRO allows you to easily create computer network diagrams and then make a PowerPoint Presentation from your network diagrams in a single click.HelpDesk
How to Add a Block Diagram to a PowerPoint Presentation Using ConceptDraw PRO
A block diagram is a useful tool both in designing new processes, and in improving existing. A block diagram is a type of chart, which is often used in presentations, because of its universality - the graphic blocks can be applied to many processes.The PowerPoint presentation of major process steps and key process participants can be very informative and helpful. Using ConceptDraw PRO, you can easily convert a block diagram to MS PowerPoint presentation.HelpDesk
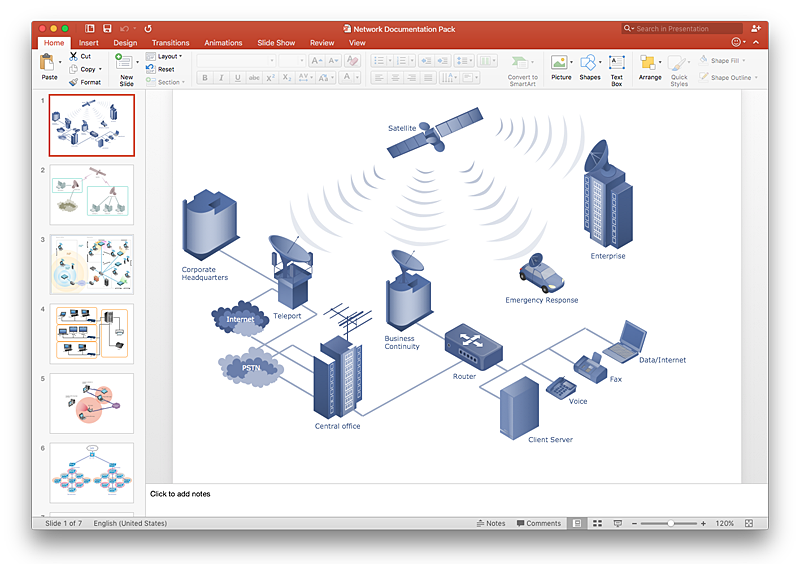
How to Add a Telecommunication Network Diagram to a PowerPoint Presentation Using ConceptDraw PRO
Telecommunication network diagram represents a system consisting of computers, servers, telecommunication devices, switches, satellites, wireless transmitters, antennas, cables, etc., that link a set of remote nodes. It is also describes a telephone exchange, that connects calls between landlines. ConceptDraw PRO allows you to easily create telecommunication network diagrams and then make a PowerPoint Presentation from your network documentation in a few clicks. Telecommunication network diagrams are used to show components and connections in a telecommunications network: how they are interacted between each other and with end-users. The PowerPoint presentation on concept of telecom network can be very informative and helpful. ConceptDraw PRO allows you to make a MS PowerPoint Presentation from your telecommunication network diagrams in a few clicks.HelpDesk
How to Create PowerPoint Presentation from Data Driven Infographics Using ConceptDraw PRO
ConceptDraw PRO can be used as a tool for creating data-driven infographics. It allows you to draw data driven using the special templates and vector stencils libraries. ConceptDraw PRO allows you to make a MS PowerPoint Presentation from your Data-driven infographics in a few simple steps.HelpDesk
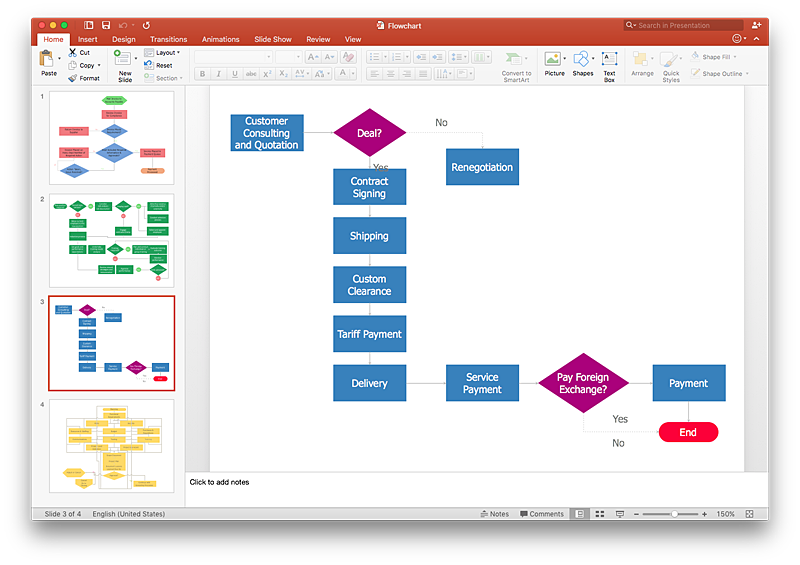
How To Make a PowerPoint Presentation of Flowcharts Using ConceptDraw PRO
ConceptDraw PRO allows you to create professional flowchart quickly and easily. The ability to create flowcharts is contained in the Flowcharts solution. To submit flowcharts for the audience, you can use export to MS PowerPoint.HelpDesk
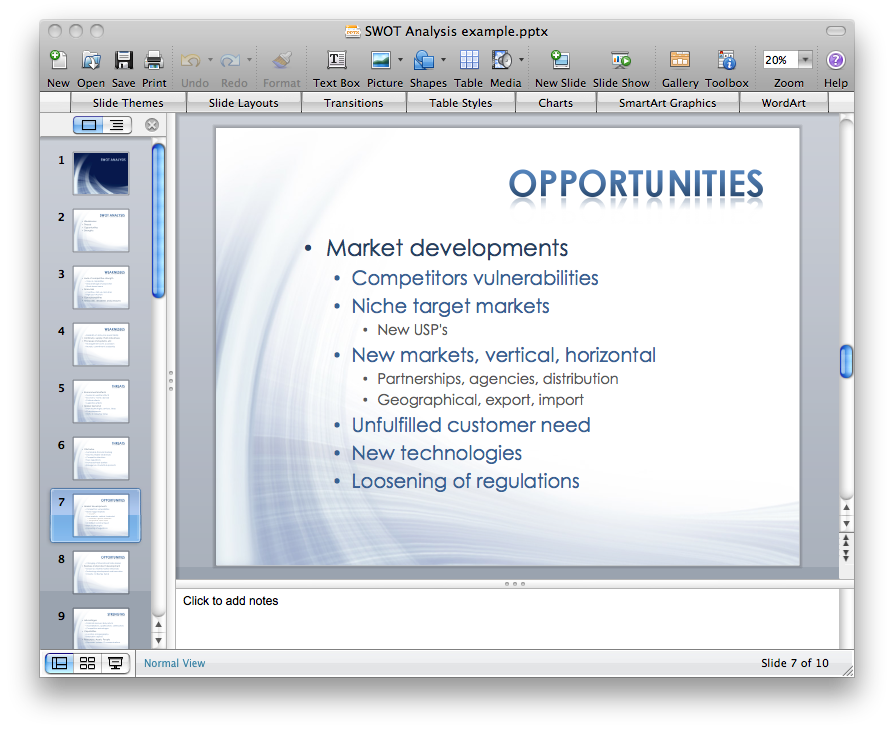
How to Create a PowerPoint Presentation from a SWOT Matrix
You can use SWOT analysis PowerPoint presentation to represent strengths, weakness, opportunities, and threats involved in your SWOT matrix.HelpDesk
How to Draw the Different Types of Pie Charts
Using the Pie Chart, you can visually estimate the relative contribution that different data categories contribute to a whole value. The pie chart displays the statistics in a visual format. The main use of pie charts to show comparisons. The larger piece of the pie, the more the value of this value compared to the rest. Various applications of pie charts can be found in business and education. For business, pie charts can be used to compare the success or failure of the goods or services. They may also be used to display the business market share.HelpDesk
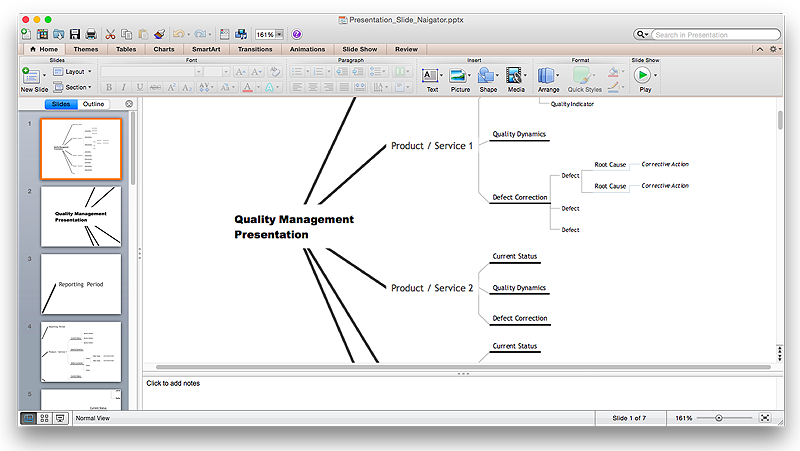
How to Create a PowerPoint® Presentation from a Mind Map
ConceptDraw MINDMAP allows you to create a traditional PowerPoint Presentation from your mind mind maps. There are two different variants when exporting to PowerPoint - one places editable text into the template of your choice, the other places the pieces of the map that you want to show into the slides.- Flow Chart For Powerpoint
- Technical Drawing Software | How To Make a PowerPoint ...
- How to Create Presentation of Your Project Gantt Chart | Flowcharts ...
- Process Flow Chart Examples Powerpoint
- Org Chart For Powerpoint
- Chart Templates For Powerpoint
- Bubble Charts | How to Add a Bubble Diagram to a PowerPoint ...
- Process Flowchart | How to Create a PowerPoint ® Presentation from ...
- How to Create Presentation of Your Project Gantt Chart | Pie Donut ...
- How To Make a PowerPoint Presentation of a Business Process ...
- How To Make a PowerPoint Presentation of a Business Process ...
- How To Do A Mind Map In PowerPoint | Organizational Chart ...
- Org Charts In Powerpoint
- Donut Chart Templates Powerpoint
- How to Add a Workflow Diagram to a PowerPoint Presentation ...
- How to Add a Workflow Diagram to a PowerPoint Presentation ...
- How To Draw A Dot Diagram Power Point
- How to Add a Cross-Functional Flowchart to a PowerPoint ...
- Pyramid Chart Examples | How to Make SWOT Analysis in a Word ...
