HelpDesk
How to Make a Basketball Court Diagram
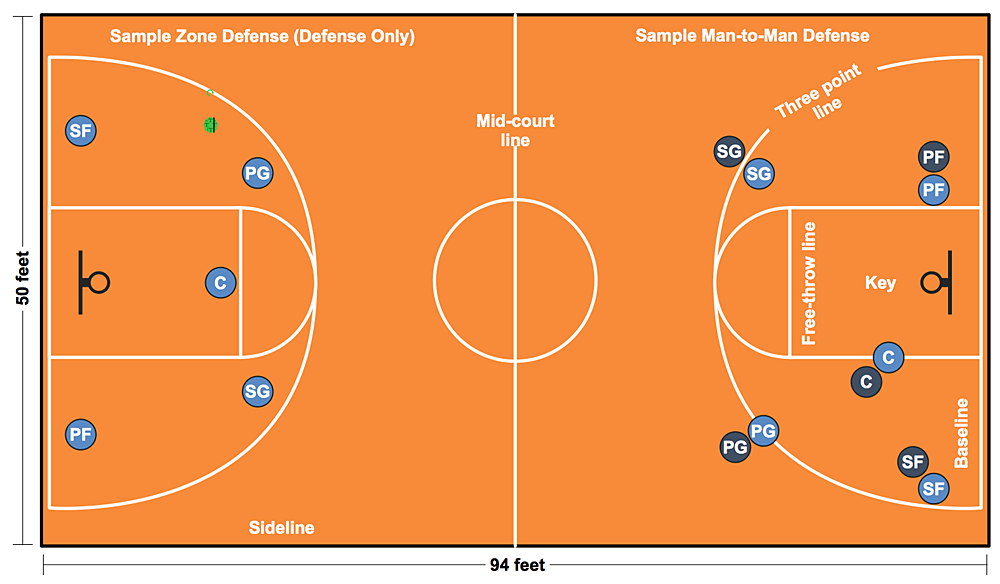
Basketball Court diagrams is often used as a teaching and learning tool for coaches, players and parents to describe the basketball moves and shooting drills. The ability to create Basketball diagrams with ConceptDraw PRO is contained in the Basketball solution. It provides a set of special tools for creating different Basketball diagrams. Basketball court diagram is used to describe basketball moves and shooting drills during the discussion of the match, as well as to develop a winning defense and attack strategy as a clear visual plans for future games.
 Basketball
The Basketball Solution extends ConceptDraw PRO v9.5 (or later) software with samples, templates, and libraries of vector objects for drawing basketball diagrams, plays schemas, and illustrations. It can be used to make professional looking documents, pre
HelpDesk
How to Create Multipage Diagram
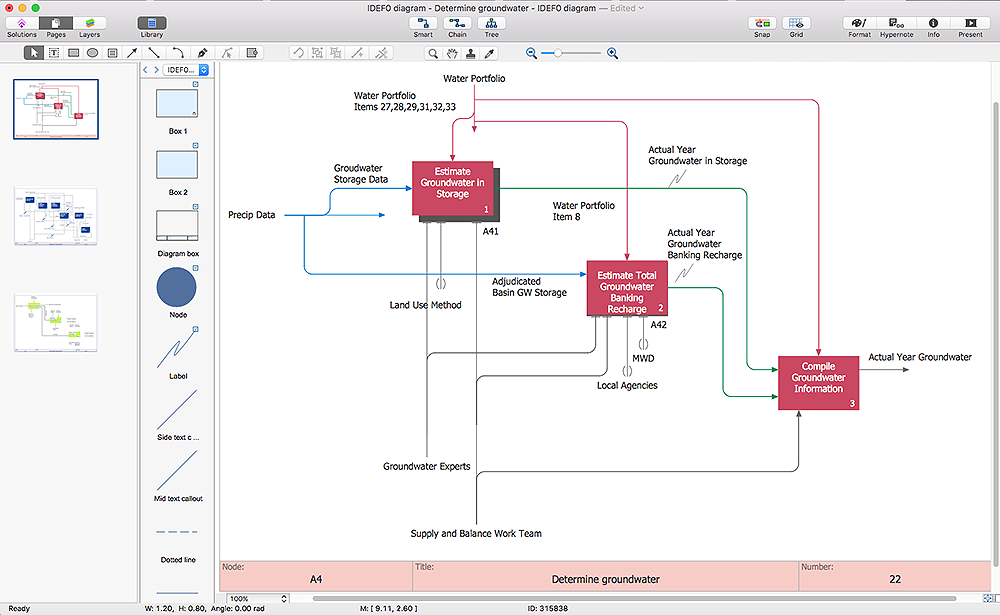
Most ConceptDraw PRO templates are one page in length. Some templates consist of two pages: the first page — as the main page, and a second page as the background page. You can customize any template for your needs by adding pages, rearranging them, or by setting a custom background.HelpDesk
How To Make Chen ER Diagram
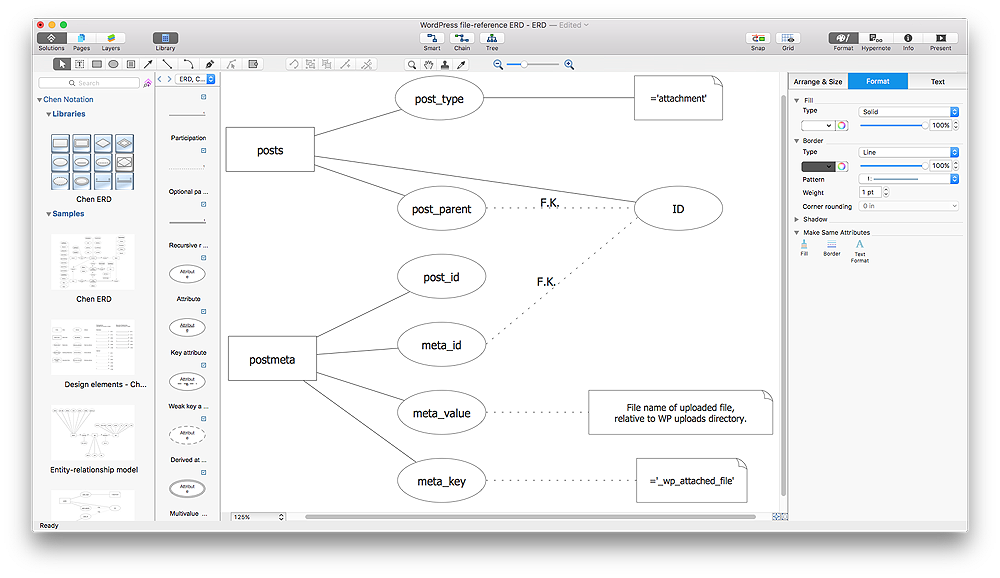
The Chen ERD notation model is a popular standard and is widely used worldwide in database and software design. The entity-relationship model proposed by Dr. Chen is constructed using a natural view of how the real world comprises entities and the relationships that exist with these identified entities. It was designed to leverage the advantages of the three entity-data models (network model, relationship model, entity model). The free Chen Notation solution for ConceptDraw PRO provides vector stencil libraries with full standardized Chen notation included.
 Seating Plans
The correct and convenient arrangement of tables, chairs and other furniture in auditoriums, theaters, cinemas, banquet halls, restaurants, and many other premises and buildings which accommodate large quantity of people, has great value and in many cases requires drawing detailed plans. The Seating Plans Solution is specially developed for their easy construction.
HelpDesk
How to Create a SysML Diagram Using ConceptDraw PRO
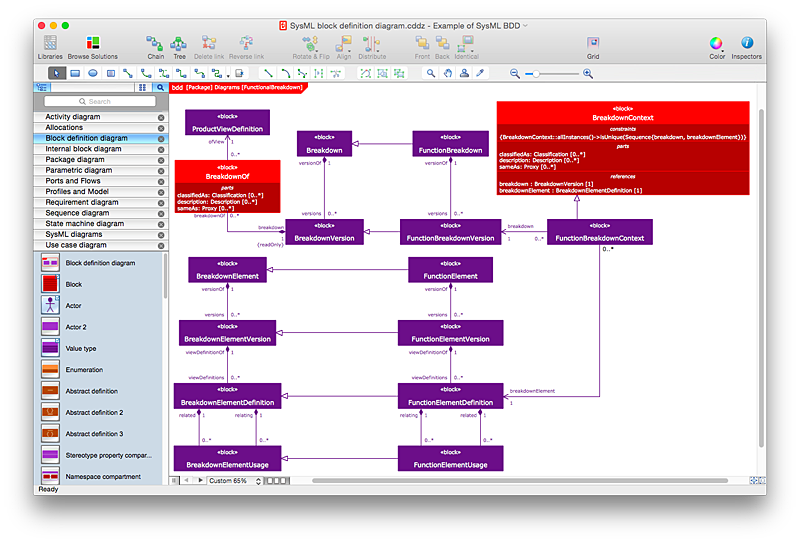
Systems Modeling Language (SysML) is designed to use for system engineering. It is similar to UML, but much easier to learn. used by to system engineers what UML is to software engineers. Smaller in content and simpler to learn than UML. SysML is focused on standardizing the language used to describe engineering systems. SysML covers a broader range of systems, than can involve personnel, facilities, hardware or electrical components. SysML depicts system using the SysML diagrams. Making a SysML diagram involves many elements that can be managed using SysML solution for ConceptDraw PRO.
 Logistics Flow Charts
Logistics Flow Charts solution extends ConceptDraw PRO v11 functionality with opportunities of powerful logistics management software. It provides large collection of predesigned vector logistic symbols, pictograms, objects and clipart to help you design with pleasure Logistics flow chart, Logistics process flow diagram, Inventory flow chart, Warehouse flowchart, Warehouse management flow chart, Inventory control flowchart, or any other Logistics diagram. Use this solution for logistics planning, to reflect logistics activities and processes of an enterprise or firm, to depict the company's supply chains, to demonstrate the ways of enhancing the economic stability on the market, to realize logistics reforms and effective products' promotion.
HelpDesk
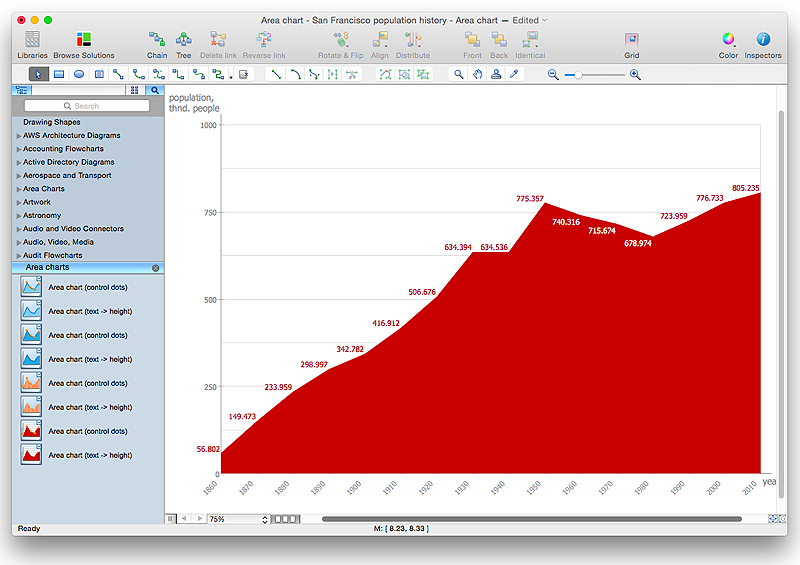
How to Draw an Area Chart in ConceptDraw PRO
Area chart is similar to a line chart, but an area chart has an area, commonly filled with color below the line. The applying of Line charts and area charts are also very similar. They both show continuity across a data set. They are both can be used for displaying time series data and for depicting tendencies better than separate values, but they have some different characteristics. Using the proper one is good chance to show once again a professionalism of your graphic documents. An area chart depicts a colored area below the line. The sum on the vertical axis of an area chart represents the entire value, while the height of each separate piece shows its parts. Area charts are used to display multiple data series with proportion to a whole value , or for separate data series showing a set of countable values, or cumulative data.HelpDesk
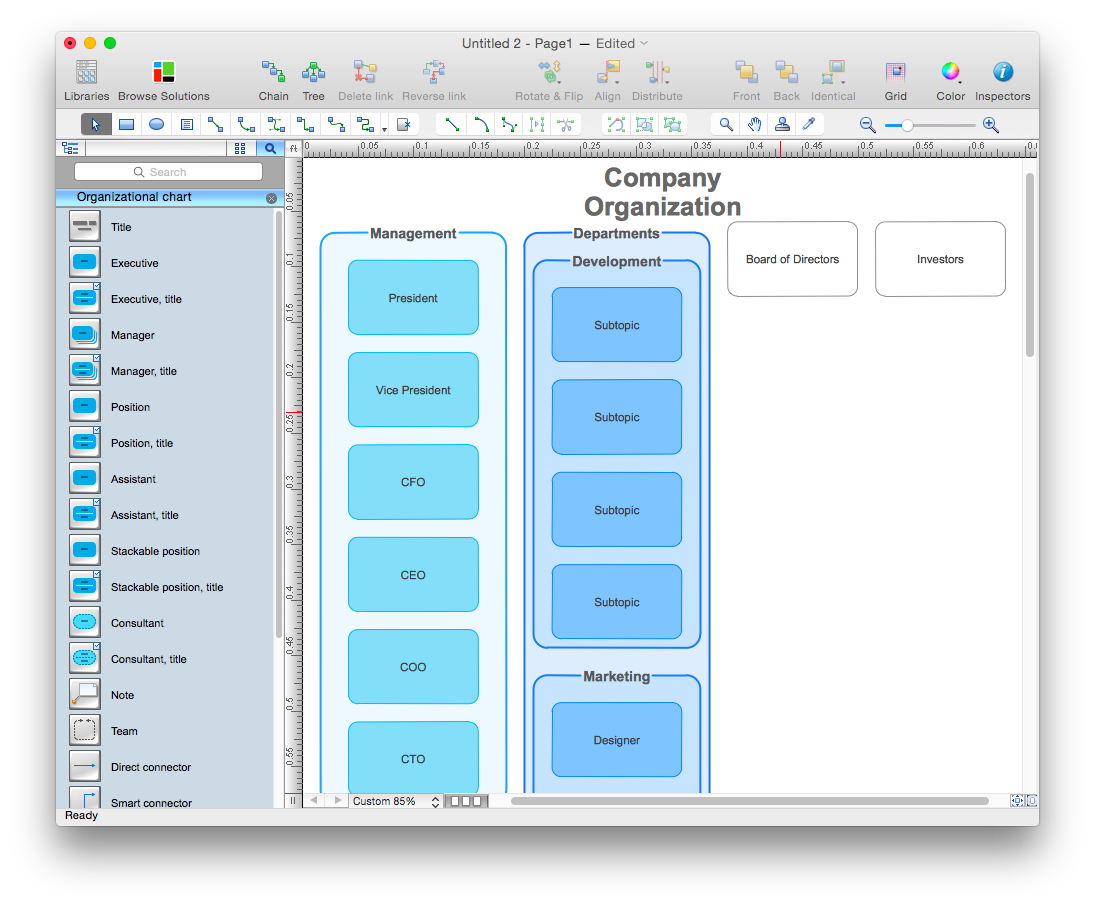
How to Create Organizational Chart Using Management Solution
Use ConceptDraw MINDMAP for generating structured data on organization structure and then ConceptDraw PRO for presenting the results as chart.- Basketball Court Diagram and Basketball Positions | How to Make a ...
- How to Make a Basketball Court Diagram | Process Flowchart | How ...
- Basketball | How to Make a Basketball Court Diagram | How to ...
- How to Make a Basketball Court Diagram | ConceptDraw Solution ...
- Process Flowchart | How to Make a Basketball Court Diagram | How ...
- Colourful Chart On Basketball
- Basketball Court Diagram and Basketball Positions | Basketball ...
- Basketball | How to Make a Basketball Court Diagram | SWOT ...
- How to Make a Basketball Court Diagram | Basketball | Basketball ...
- How to Make a Basketball Court Diagram | Basketball Plays ...
- Football | Basketball Plays Diagrams | How to Make Soccer Position ...
- Basketball Court Diagram and Basketball Positions | How to Make a ...
- Process Flowchart | Basketball Illustrations | Flow Chart for Olympic ...
- How to Make a Basketball Court Diagram | How to Design a Fast ...
- Flow Chart for Olympic Sports | Basketball Court Dimensions ...
- How to Make a Basketball Court Diagram | Basketball | Sport Field ...
- How to Make a Basketball Court Diagram | Seating Plans | How To ...
- Sport Field Plans | How to Make Soccer Position Diagram Using ...
- How to Make a Basketball Court Diagram | Landscape & Garden ...
