HelpDesk
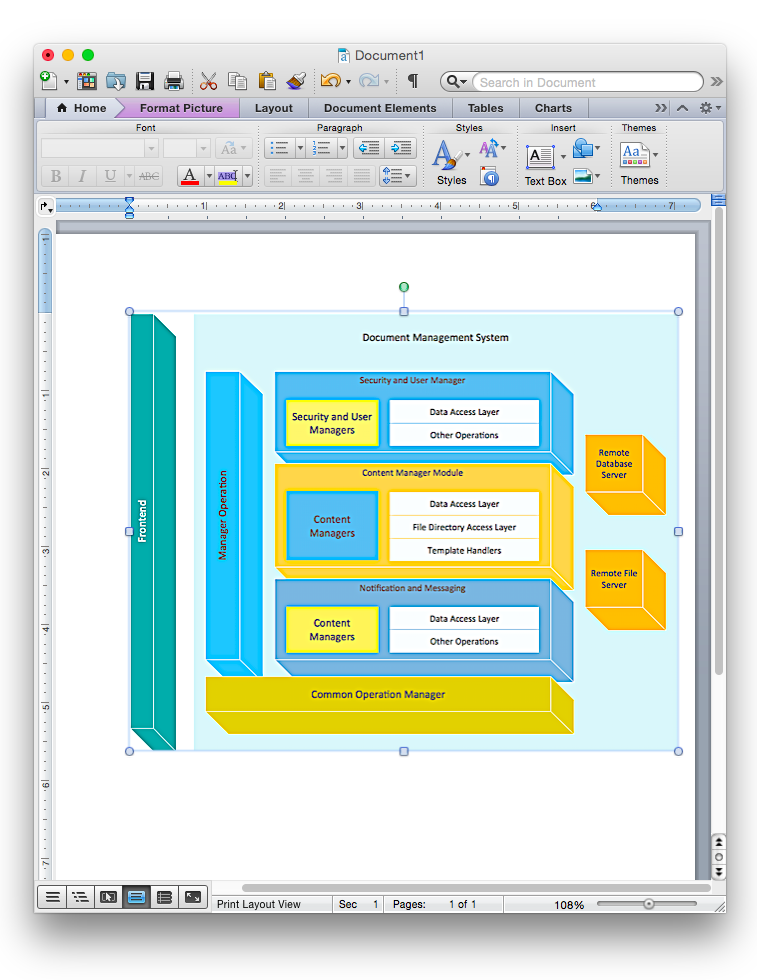
How to Add a Block Diagram to a MS Word ™ Document Using ConceptDraw PRO
Block diagram consists from graphic blocks. Blocks are connected by lines or arrows. Block diagrams are used to show the relationship between parts of some systems. It can be used for the development of new systems or to improve existing ones. The structure of block diagram gives a high-level overview of the major components of the system, as well as the important relationships. Using the block diagrams, you can more effectively present the business data contained in your MS Word documents. ConceptDraw PRO allows you to easily create block diagrams and then insert them into a MS Word document.HelpDesk
How to Add a Block Diagram to a PowerPoint Presentation Using ConceptDraw PRO
A block diagram is a useful tool both in designing new processes, and in improving existing. A block diagram is a type of chart, which is often used in presentations, because of its universality - the graphic blocks can be applied to many processes.The PowerPoint presentation of major process steps and key process participants can be very informative and helpful. Using ConceptDraw PRO, you can easily convert a block diagram to MS PowerPoint presentation.HelpDesk
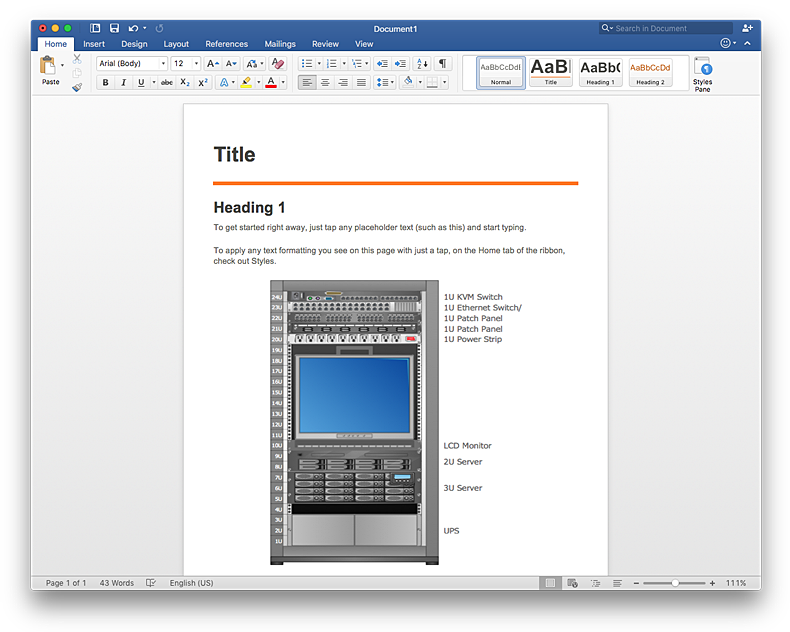
How to Add a Rack Diagram to a MS Word Document Using ConceptDraw PRO
Rack Diagram depicts the structure of network equipment installation, and provides network administrator with the base to support electronic equipment, power, cooling, and cable management. ConceptDraw PRO allows you to easily create diagram that will help to detail the type of rack equipment that best fits your needs and then lets you to insert the scheme of rack configuration into the network documentation pack. ConceptDraw PRO allows you to easily create rack configuration diagrams and then insert them into a MS Word document.HelpDesk
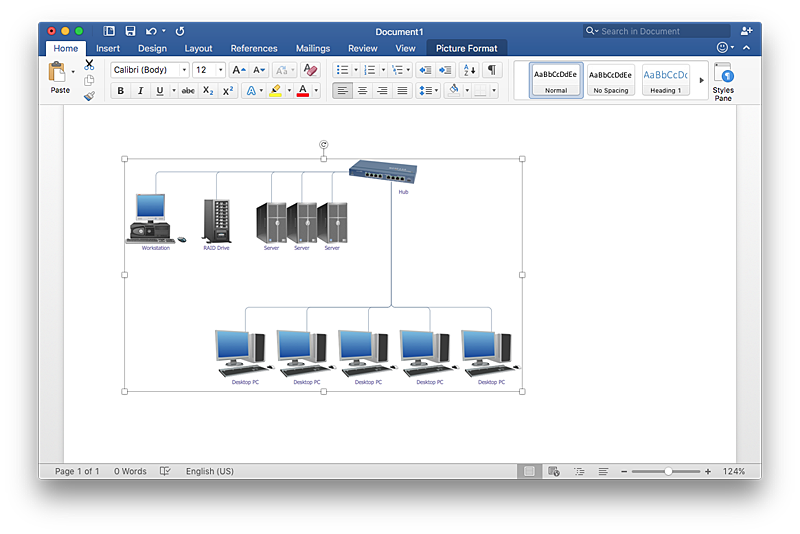
How to Add a Network Diagram to a MS Word Document Using ConceptDraw PRO
Effective management of the computer network of any size includes the creation and maintenance of the network documentation package. Computer network diagrams may be the part of the network documentation that is often presented as MS Word document. Network diagrams describing the topology of the network and equipment installed in the network, are the essential part of this package. ConceptDraw PRO provides network administrators with ability to easily create computer network diagrams and then insert them into a MS Word document.
 Block Diagrams
Block diagrams solution extends ConceptDraw PRO software with templates, samples and libraries of vector stencils for drawing the block diagrams.
HelpDesk
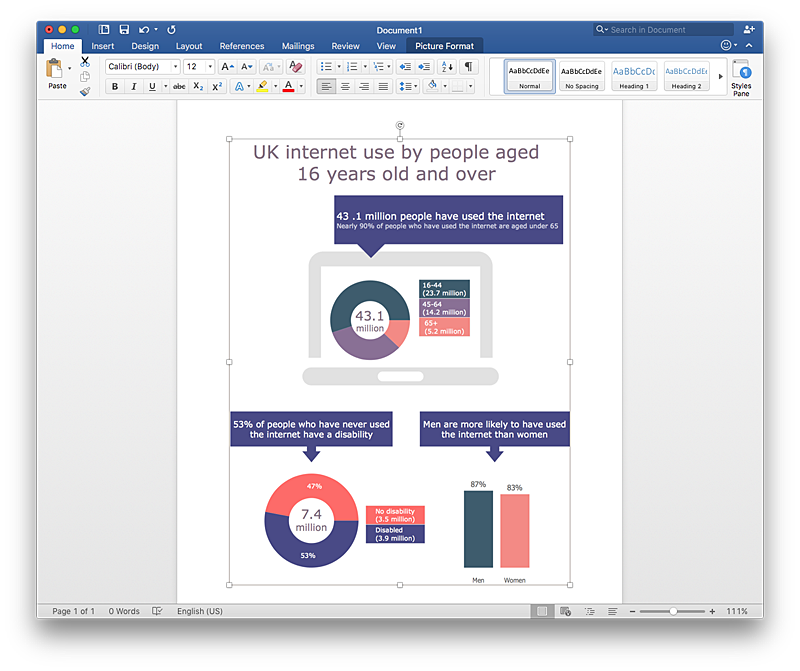
How to Add Data-driven Infographics to a MS Word Document Using ConceptDraw PRO
Infographics ae usually used as an effective way of showing a certain portion of information . There are a wide of range of subjects that can be represented in a such way. One of the most simple usage for the infographics, in business diagrams. Sales staff can use it as an effective method of sharing the sales results with the entire team and stakeholders. ConceptDraw Data-driven Infographics solution gives all the tools one need to present a certain type of data. ConceptDraw PRO allows you to easily create data-driven infographics and then insert them into a MS Word document.HelpDesk
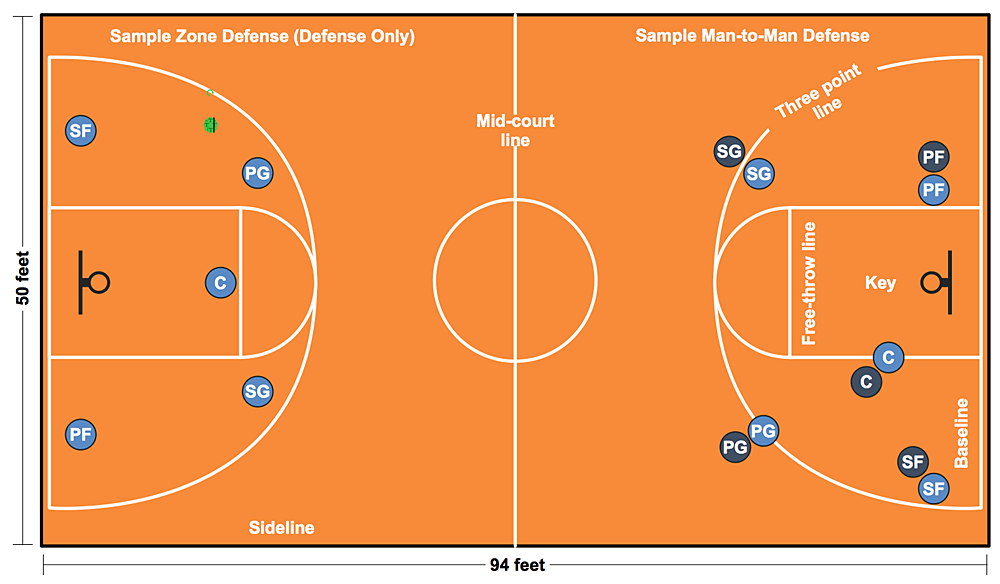
How to Make a Basketball Court Diagram
Basketball Court diagrams is often used as a teaching and learning tool for coaches, players and parents to describe the basketball moves and shooting drills. The ability to create Basketball diagrams with ConceptDraw PRO is contained in the Basketball solution. It provides a set of special tools for creating different Basketball diagrams. Basketball court diagram is used to describe basketball moves and shooting drills during the discussion of the match, as well as to develop a winning defense and attack strategy as a clear visual plans for future games.
 IDEF0 Diagrams
IDEF0 Diagrams visualize system models using the Integration Definition for Function Modeling (IDEF) methodology. Use them for analysis, development and integration of information and software systems, and business process modelling.
- How to Add a Block Diagram to a MS Word ™ Document Using ...
- How To Draw Block Diagram In Microsoft Powerpoint
- How To Make Block Diagram In Microsoft Word
- Can We Make Block Diagram In Ms Word
- How to Add a Block Diagram to a MS Word ™ Document Using ...
- How To Make Block Diagram On Ms Word
- How to Add a Block Diagram to a MS Word ™ Document Using ...
- How to Add a Block Diagram to a MS Word ™ Document Using ...
- How To Draw A Block Diagram In Microsoft Word
- Basic Diagramming | How to Add a Block Diagram to a MS Word ...
- How To Make Block Diagrams In Microsoft Word
- How to Add a Block Diagram to a MS Word ™ Document Using ...
- How to Add a Block Diagram to a MS Word ™ Document Using ...
- How To Draw Block Diagram In Microsoft Word
- How To Make Block Diagram For Project
- Block Diagrams | UML Block Diagram | Functional Block Diagram ...
- Steps Of Drawing A Functional Block Diagram
- How to Add a Block Diagram to a MS Word ™ Document Using ...
- How To Insert Block Diagram In Ms Word
- Venn Diagram Template for Word | How to Add a Block Diagram to a ...
