Prioritization Matrix
You can design the Prioritization Matrix by hand on the paper, but we offer you the most easier way - to use the ConceptDraw PRO diagramming and vector drawing software extended with Seven Management and Planning Tools Solution from the Management Area.Wireless Network Mode
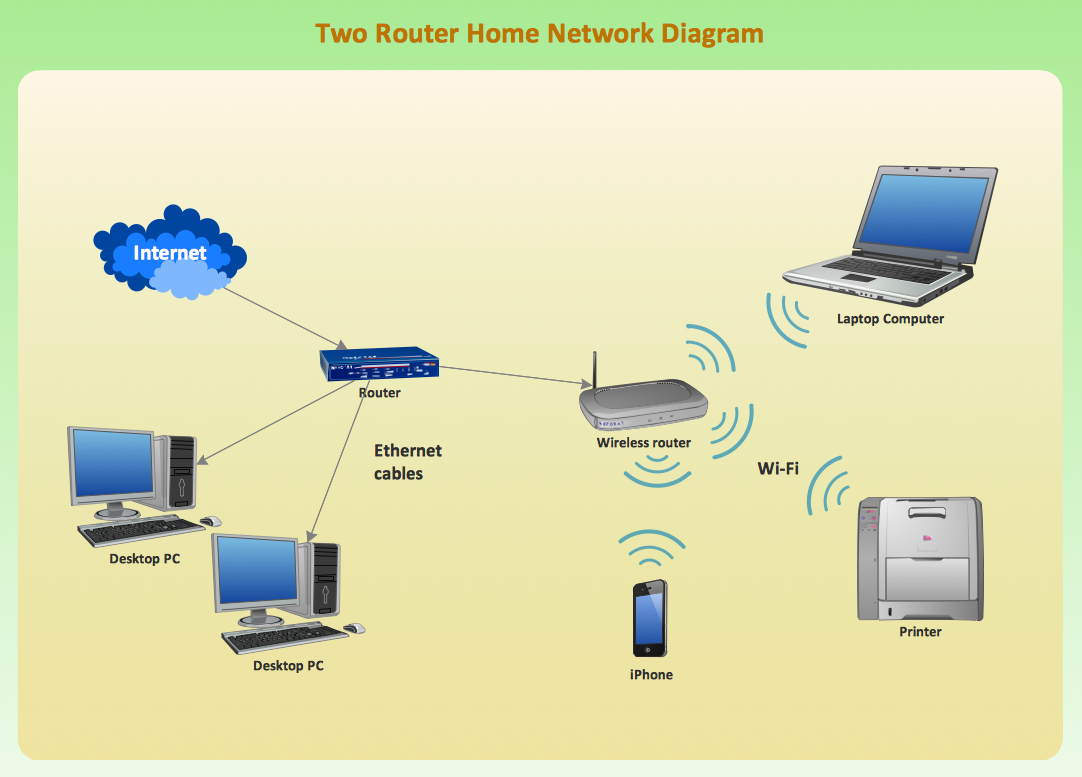
Wireless network mode engineers can schematically diagram with help of the ConceptDraw PRO best Network Diagramming software.Pie Donut Chart. Pie Chart Examples
This sample shows the Pie Donut Chart. It was created in ConceptDraw PRO diagramming and vector drawing software using the ready-to-use object from the Pie Charts Solution from Graphs and Charts area of ConceptDraw Solution Park. The Pie Donut Chart visualizes the percentage of parts of the whole and looks like as a ring divided into sectors. Pie Donut Charts are widely used in the business, statistics, analytics, mass media.
 Meter Dashboard
Meter dashboard solution extends ConceptDraw PRO software with templates, samples and vector stencils library with meter indicators for drawing visual dashboards showing quantitative data.
Relative Value Chart Software
Relative value is a value measured in the terms of liquidity, risks, return of one investment or financial instrument relative to another. Relative values are widely used in:business, economics, investment, management, marketing, statistics, etc. ConceptDraw PRO software is the best for drawing professional looking Relative Value Charts. ConceptDraw PRO provides Divided Bar Diagrams solution from the Graphs and Charts Area of ConceptDraw Solution Park.Purchasing Flow Chart. Purchasing Flowchart Example
This sample shows the Purchasing Flow Chart Diagram that displays the money flow in the carbon offset sphere. The carbon offsets are the compensatory measures that the companies make for the carbon emissions. You can see on this sample the groups that have interests in the carbon offsets and the money flow after the carbon offset vendors sold the carbon offsets.Bar Diagrams for Problem Solving. Create manufacturing and economics bar charts with Bar Graphs Solution
Create bar charts for visualizing problem solving in manufacturing and economics using the ConceptDraw PRO diagramming and vector drawing software extended with the Bar Graphs Solution from the Graphs and Charts area of ConceptDraw Solition Park.
 Matrices
This solution extends ConceptDraw PRO software with samples, templates and library of design elements for drawing the business matrix diagrams.
ConceptDraw PRO 9 Comparison with Omnigraffle Professional and MS Visio
ConceptDraw PRO comparison with Omnigraffle Professional and MS Visio shows you the significant benefits of ConceptDraw PRO, which offers varied useful drawing tools, the capability of creation multi-page documents, wide export / import capabilities in graphic formats, integration with Visio and Microsoft Office applications, availability of built-in scripting language and ConceptDraw Solution Park with numerous solutions, vector objects libraries, templates and samples. Business today is conducted with incredible rate and dynamic presentations become very popular. Sometimes while conducting the business, may happen that you can't describe some situation, state, or process with only words. In these cases it is convenient to include graphics and diagrams associated with the text. This guarantees successful communication with other stakeholders and team members, and faultless understanding the information by them. The combination of words and graphics is ideal combination, it improves the clarity and removes any doubt. ConceptDraw PRO helps you easy create any kinds of diagrams and dynamic presentations too.- Project Management Return On Investment Calculation
- Design elements - Prioritization matrix | Opportunity prioritization ...
- Process Flowchart | Investment and construction application ...
- Prioritization matrix - Template | How To Create a Prioritization ...
- PROBLEM ANALYSIS. Prioritization Matrix | Prioritization Matrix ...
- How To Create a Prioritization Matrix | PROBLEM ANALYSIS ...
- How To Create a Prioritization Matrix | Prioritization Matrix ...
- Prioritization Matrix | Opportunity prioritization matrix | Sales activity ...
- Feature Comparison Chart Software | Comparison Dashboard ...


