HelpDesk
How to Protect a Document From Performing Unwanted Operations
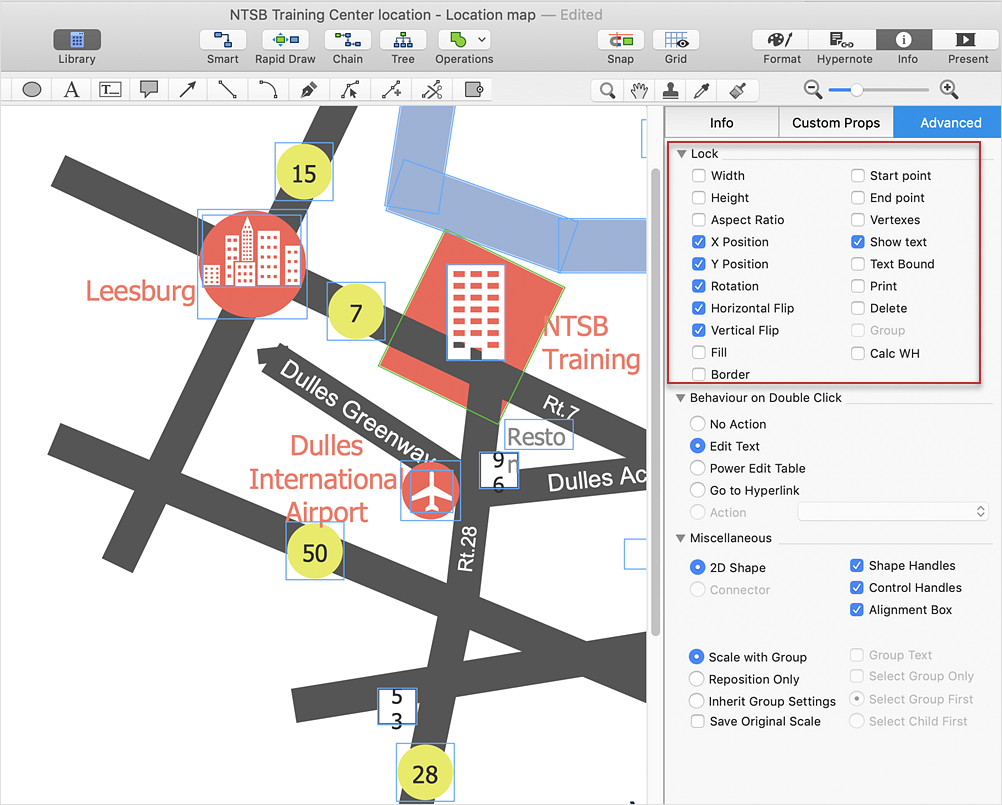
Tips on how to protect a ConceptDraw document from unwanted changes. ConceptDraw DIAGRAM gives you the possibility to prevent unexpected changes to your drawings. You can protect separate objects within the document as well as the entire document. You can protect objects from deletion, resizing or moving.Network Security Devices
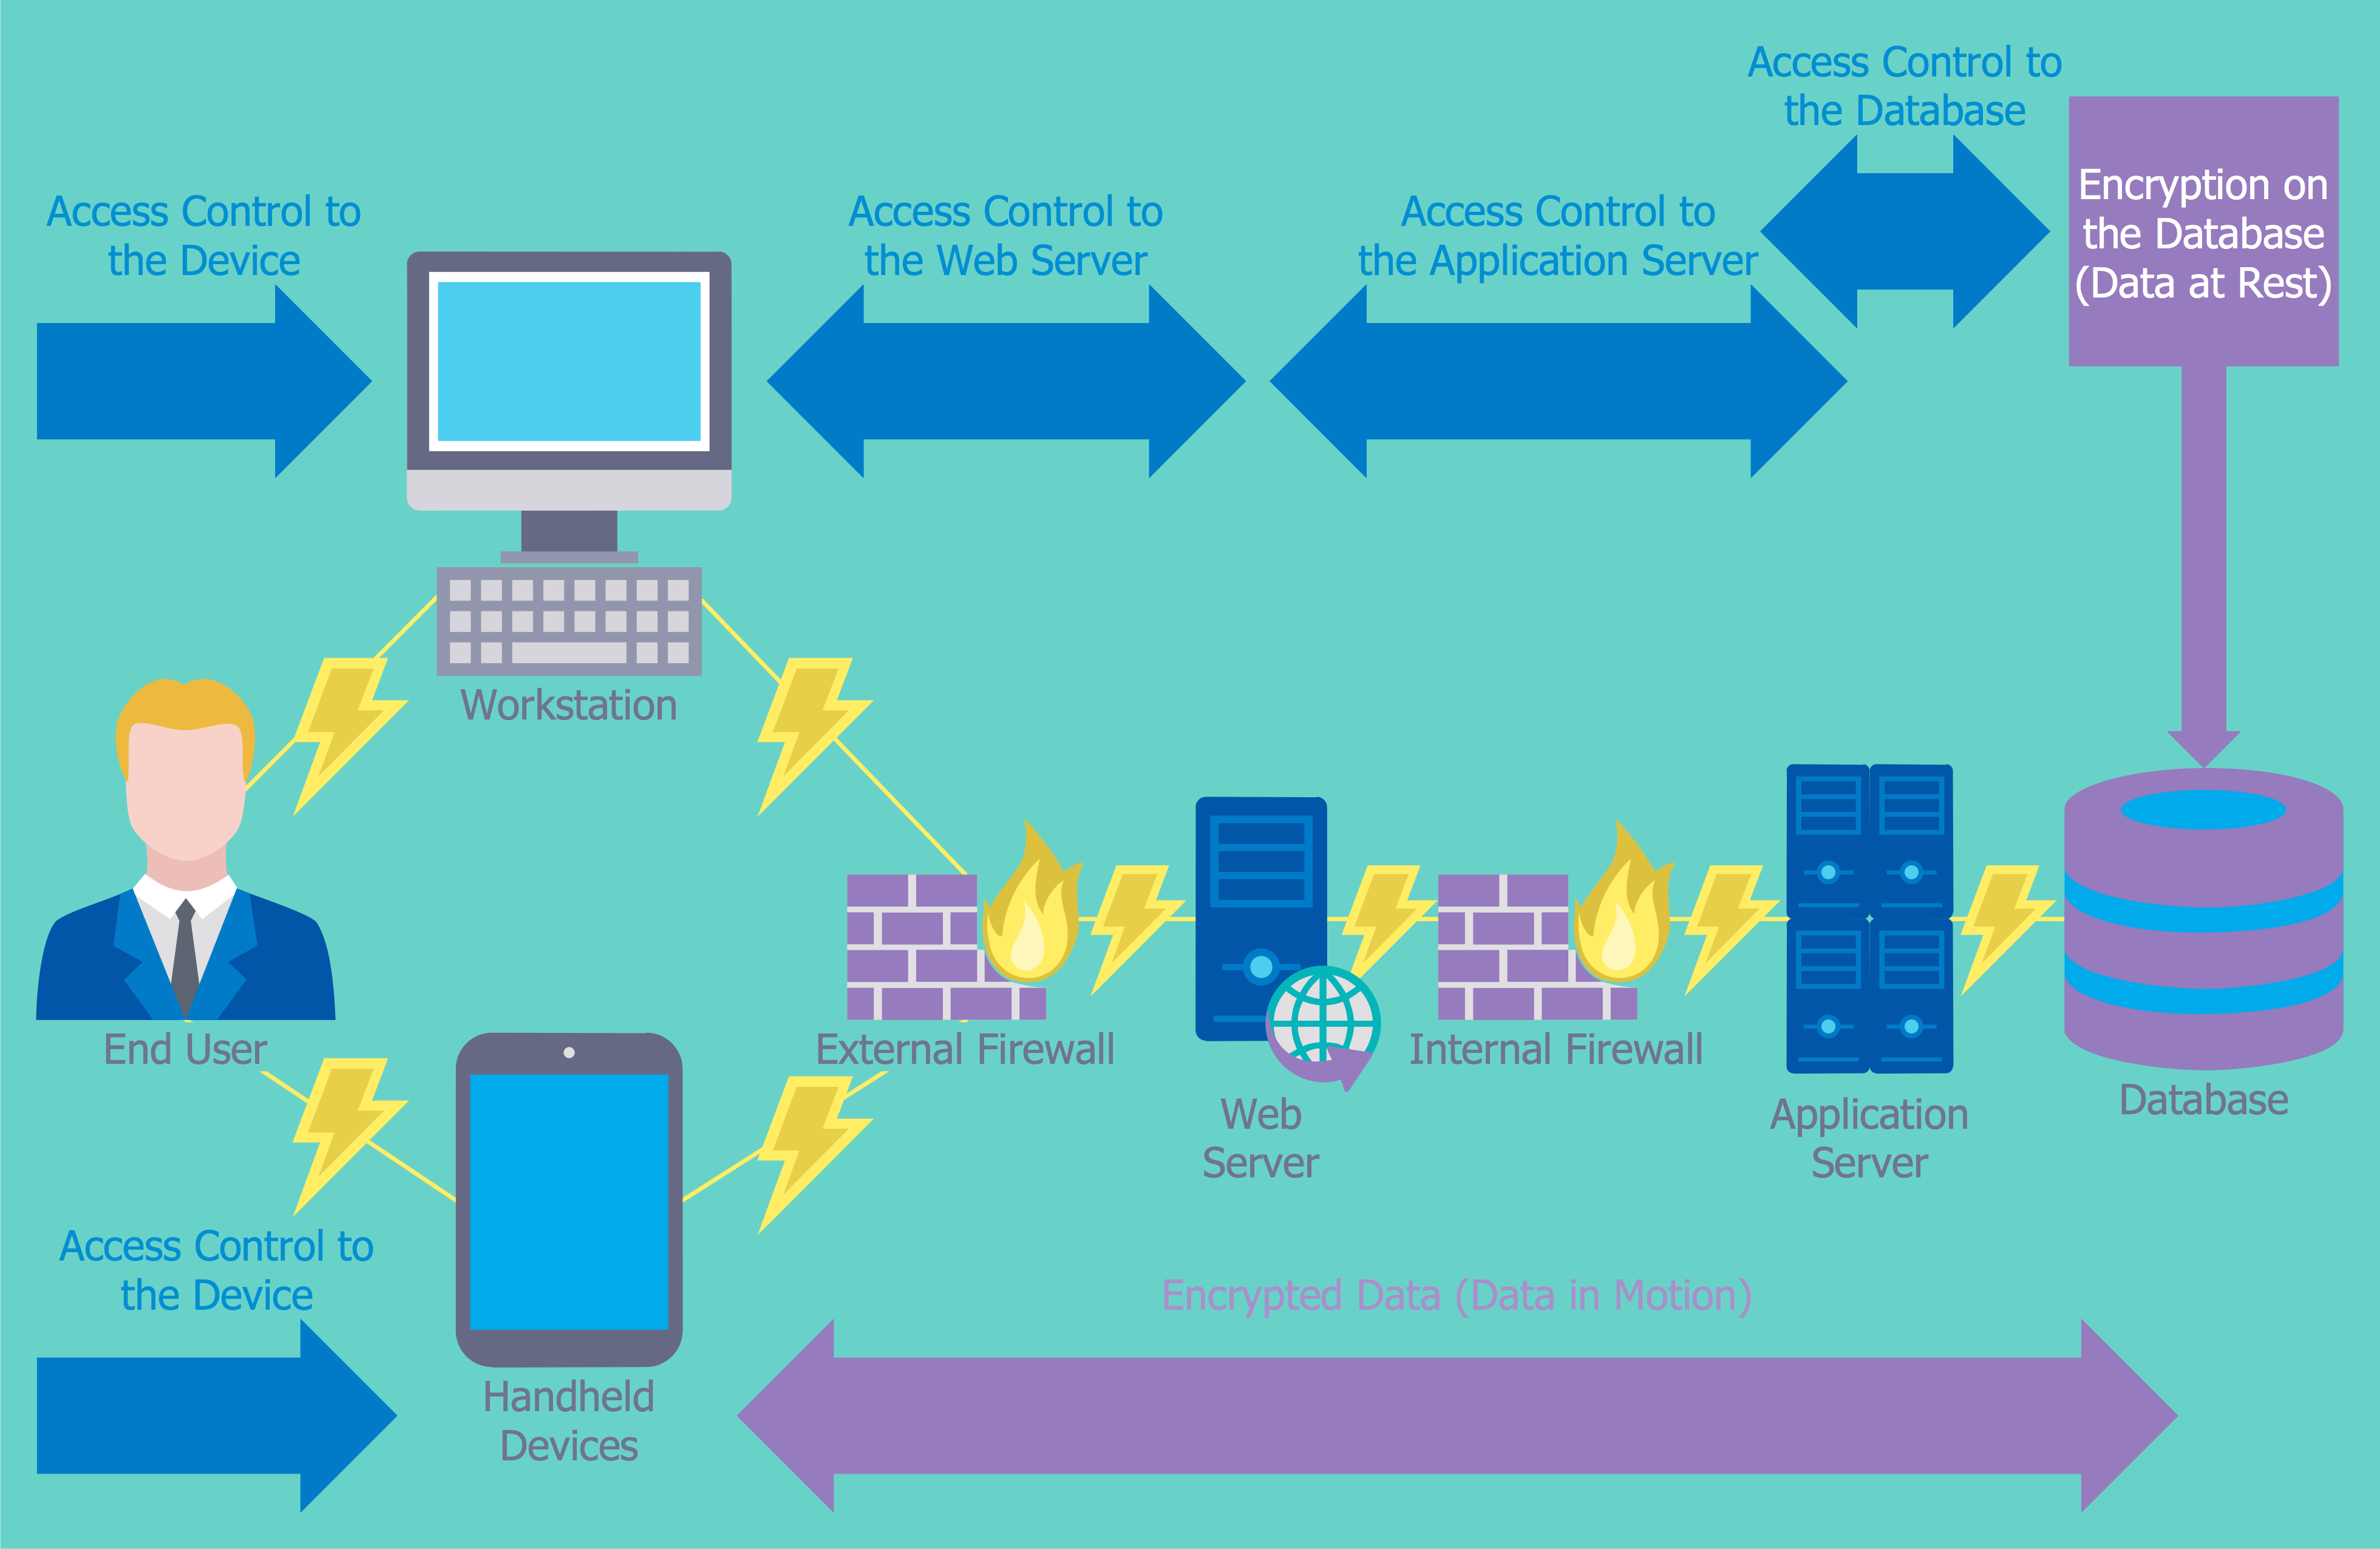
How to describe the necessity of using network security devices and visually illustrate this information? Now, it's very easy thanks to the ConceptDraw DIAGRAM diagramming and vector drawing software extended with Network Security Diagrams Solution from the Computer and Networks Area of ConceptDraw Solution Park.HelpDesk
How To Design Regulatory Documents with use of Standard GHS Pictograms
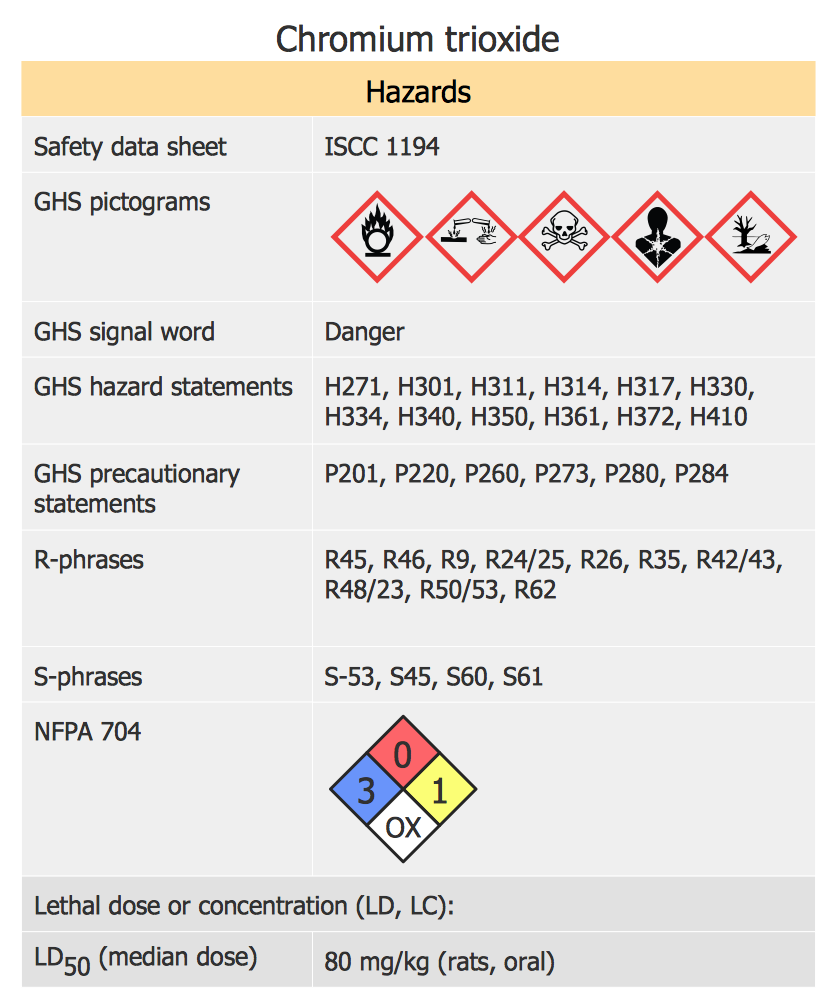
A hazard pictogram is intended to provide information about the hazard that can cause damage to human health or the environment. GHS Hazard pictogram consists of a standard hazard symbol placed to the shape of a red diamond with a white background. GHS Hazard Pictograms solution from the ConceptDraw Solution Park includes the set of standardized GHS hazard pictograms. It can be used for creating safety infographics, warning announcements, labels and regulatory documentation containing the elements of OSHA HAZCOM Standard.Network Security
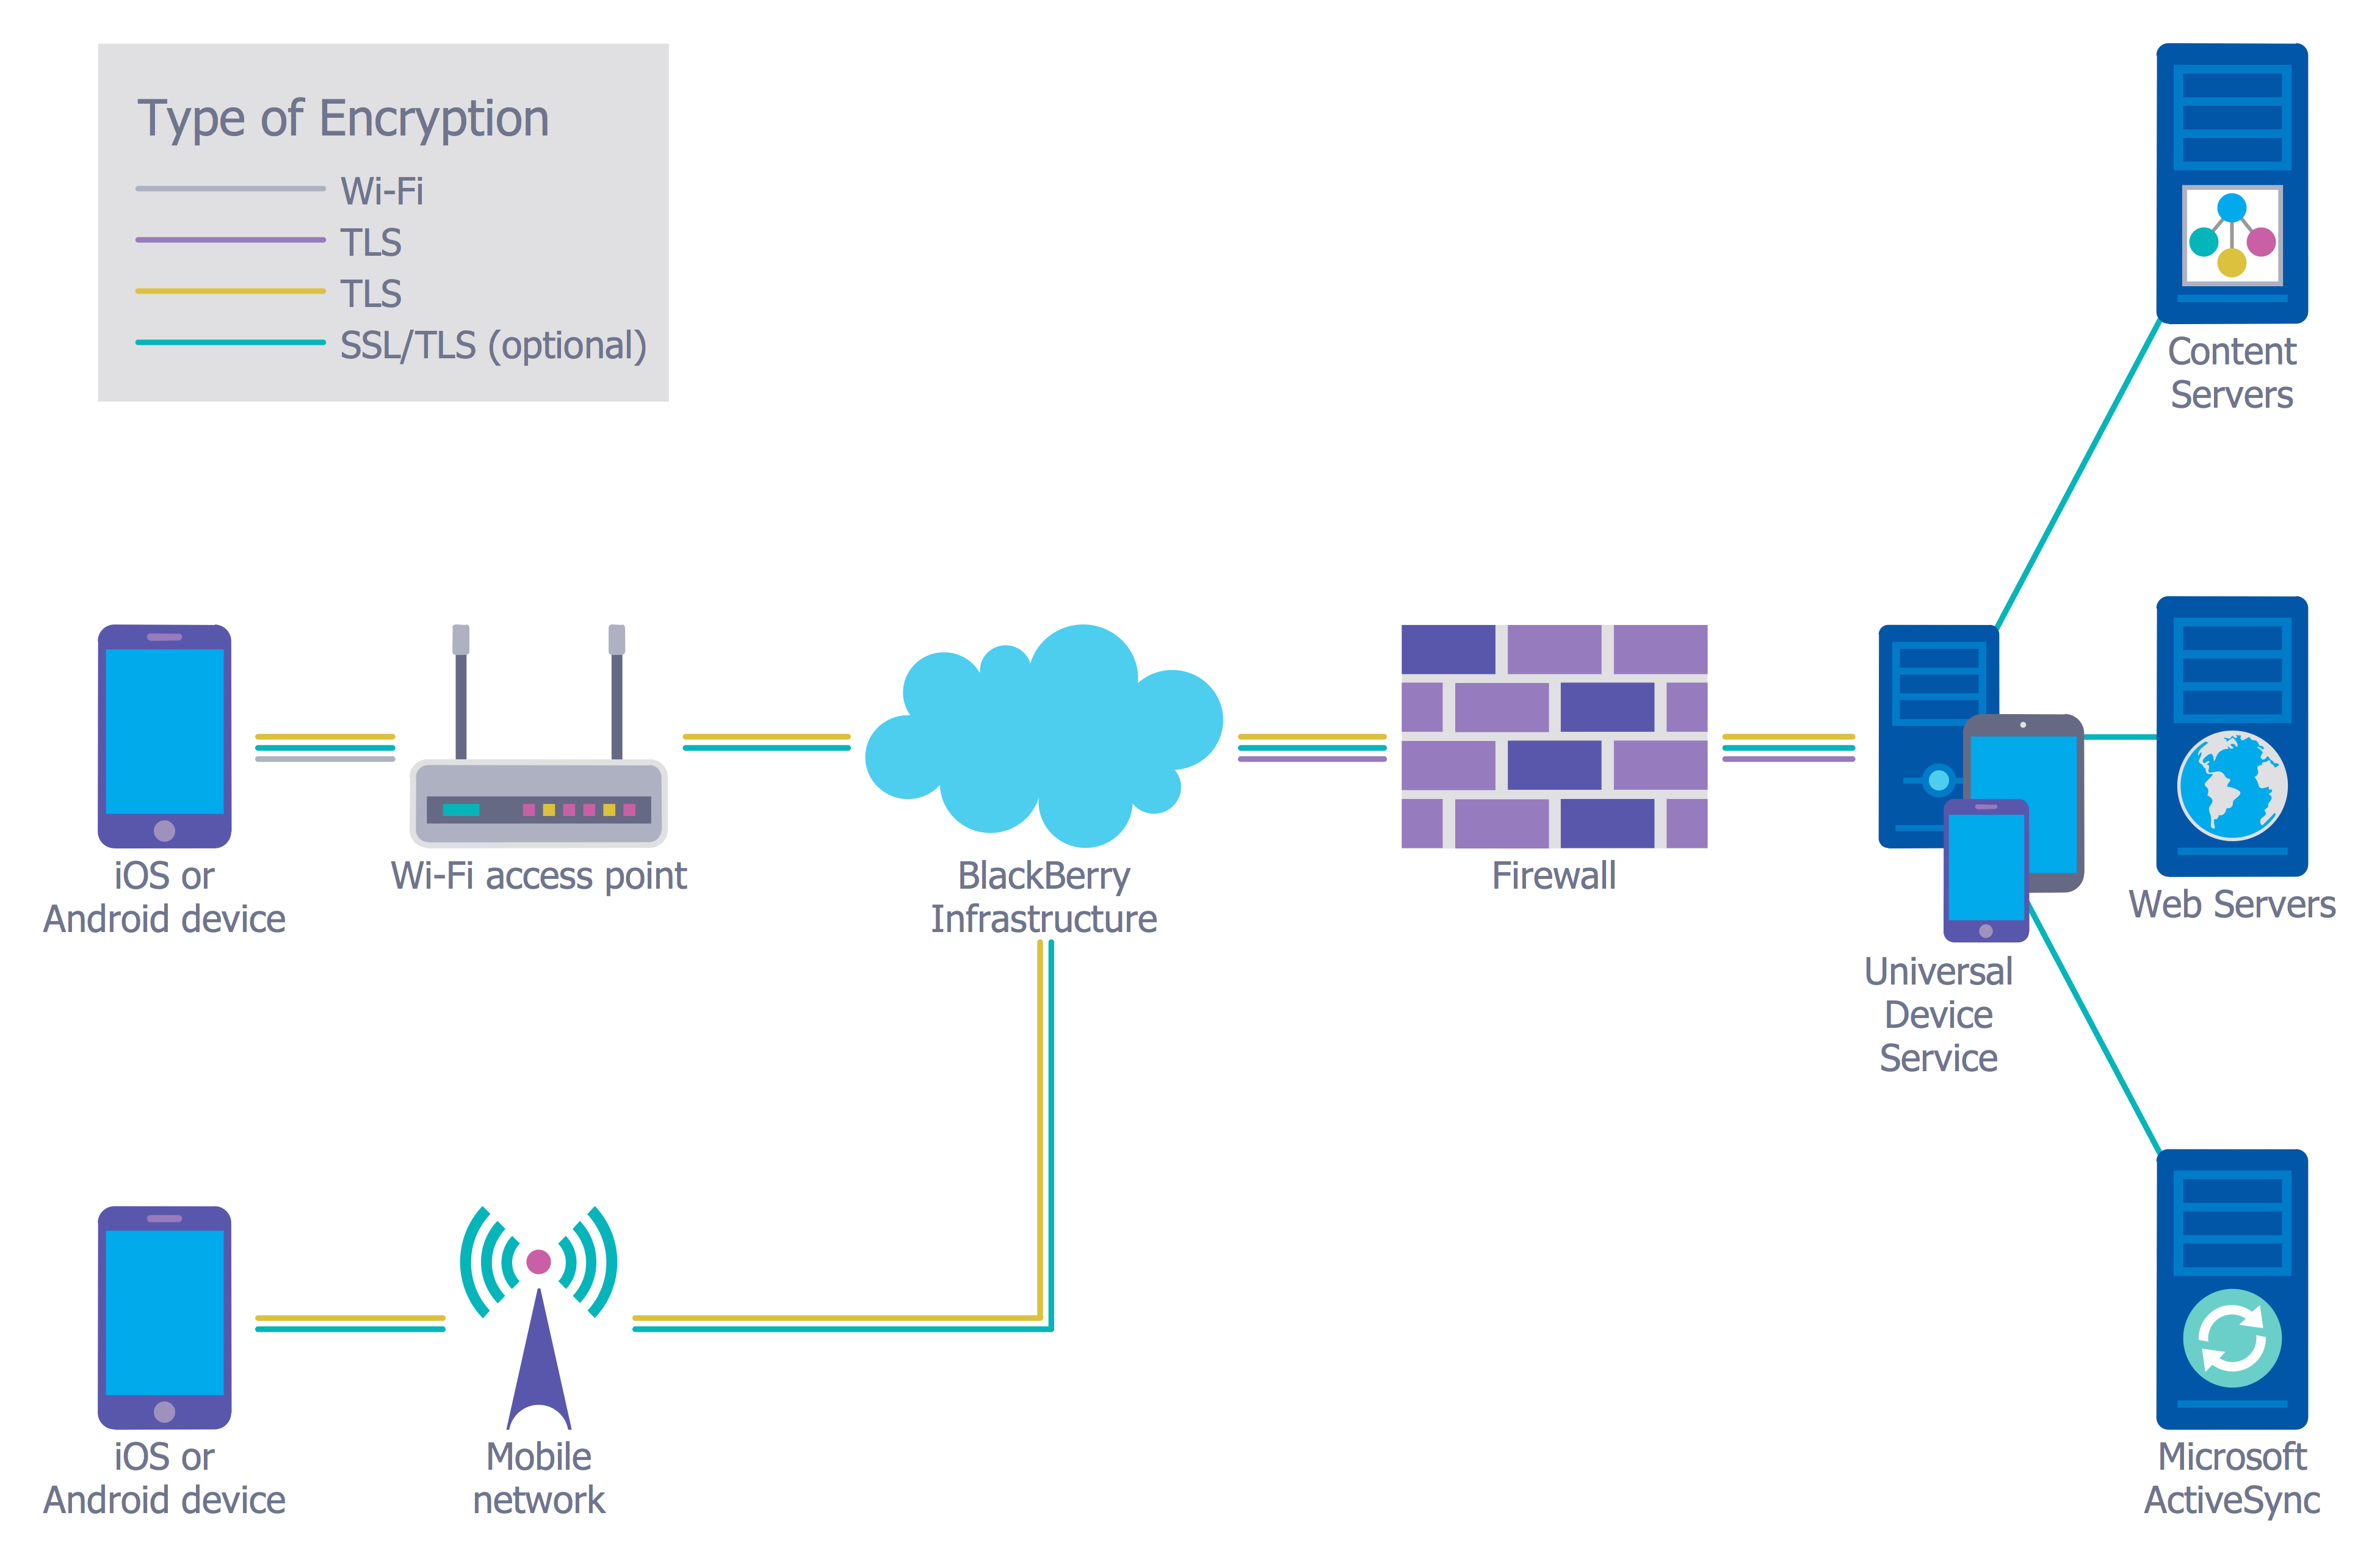
The Internet is a giant computer network which connects computers all over the world. It is integral part of human society and business. But the serious question for network engineers, designers, lawmakers and enforcers is the need for protect the Internet networks from the Internet crimes, hacking and attacks. There are quite a number of hardware, software and physical methods of protection against them. The samples you see on this page were created in ConceptDraw DIAGRAM using the tools of Network Security Diagrams Solution for ConceptDraw DIAGRAM software. They show protection networks with Firewalls and other network security devices.HelpDesk
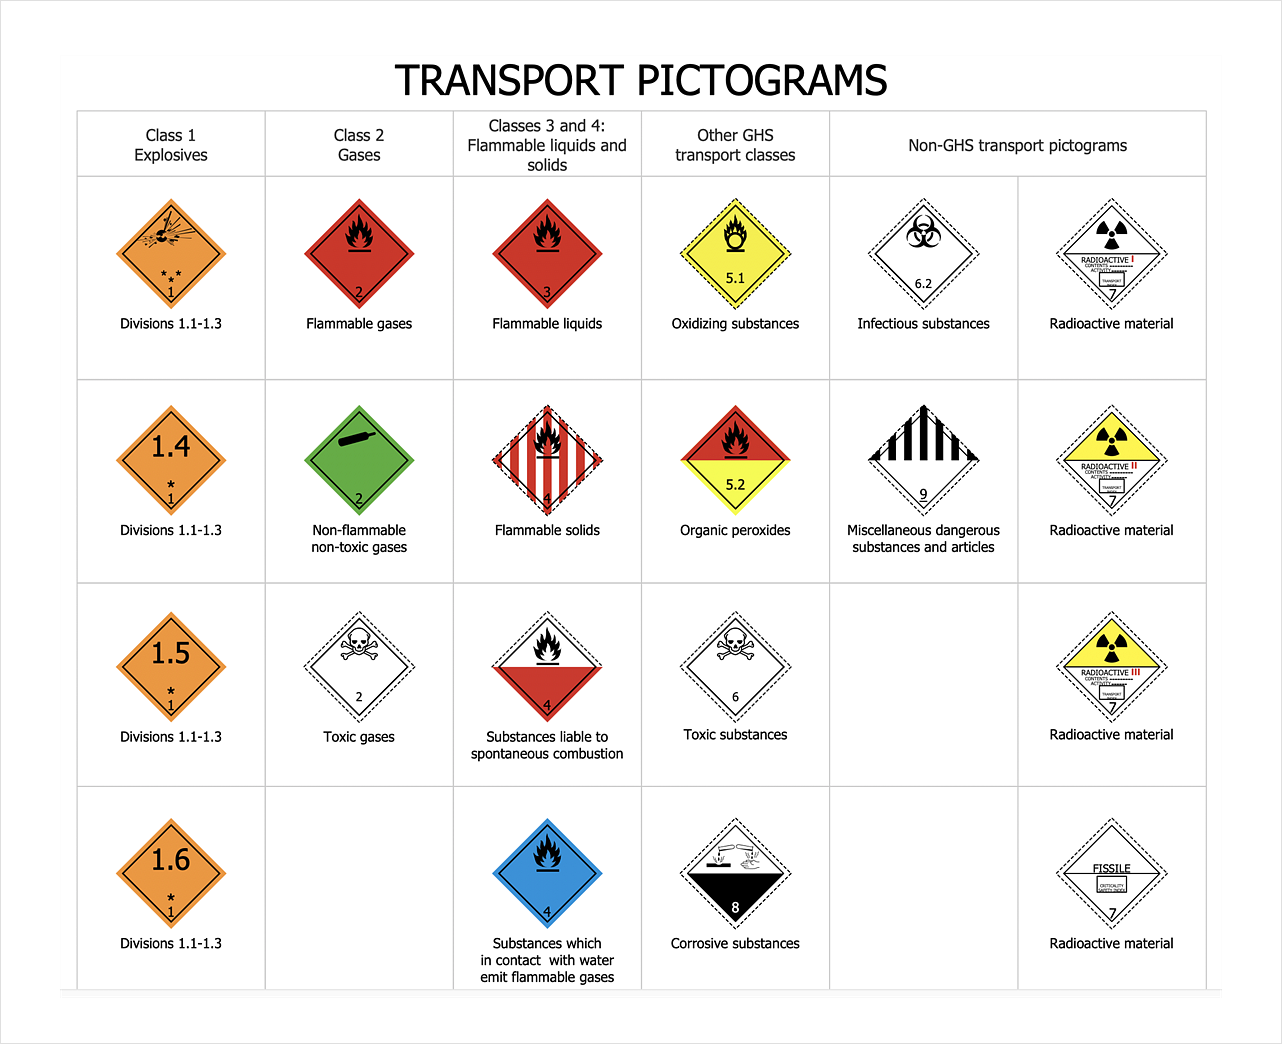
How To Design Warning Infographics Using Transport Hazard Pictograms
A hazard pictogram is intended to provide information about the hazard that can cause a damage of a human health or the environment. GHS Hazard pictogram consists from a standard hazard symbol placed to the shape of a red diamond with a white background. GHS Hazard Pictograms solution from the ConceptDraw Solution Park includes the set of standardized GHS hazard pictograms. It can be used for creating safety infographics, warning announcements, labels and regulatory documentation containing the elements of OSHA HAZCOM Standard.
 Network Security Diagrams
The Network Security Diagrams solution presents a large collection of predesigned cybersecurity vector stencils, cliparts, shapes, icons and connectors to help you succeed in designing professional and accurate Network Security Diagrams, Network Security Infographics to share knowledge about effective ways of networks protection with help of software and network security devices of different cyber security degrees, Network Plans for secure wireless network, Computer Security Diagrams to visually tell about amazing possibilities of IT security solutions. The samples and examples reflect the power of ConceptDraw DIAGRAM software in drawing Network Security Diagrams, give the representation about variety of existing types of attacks and threats, help to realize their seriousness and the methods to deal with them.
Cyber Security Degrees
For protection various cyber environments are developed and applied large variety of cyber security standards, techniques, security concepts and approaches with different cyber security degrees. The ConceptDraw DIAGRAM diagramming and vector drawing software extended with Network Security Diagrams Solution from the Computer and Networks Area of ConceptDraw Solution Park offers the number of useful tools which will help network security engineers, cyber security specialists, network and computer analysts easily and visually depict the knowledge and skills for research and prevention of intrusions, about protection critical information and analysis of cyber incidents, and for how to assess threats and vulnerabilities.HelpDesk
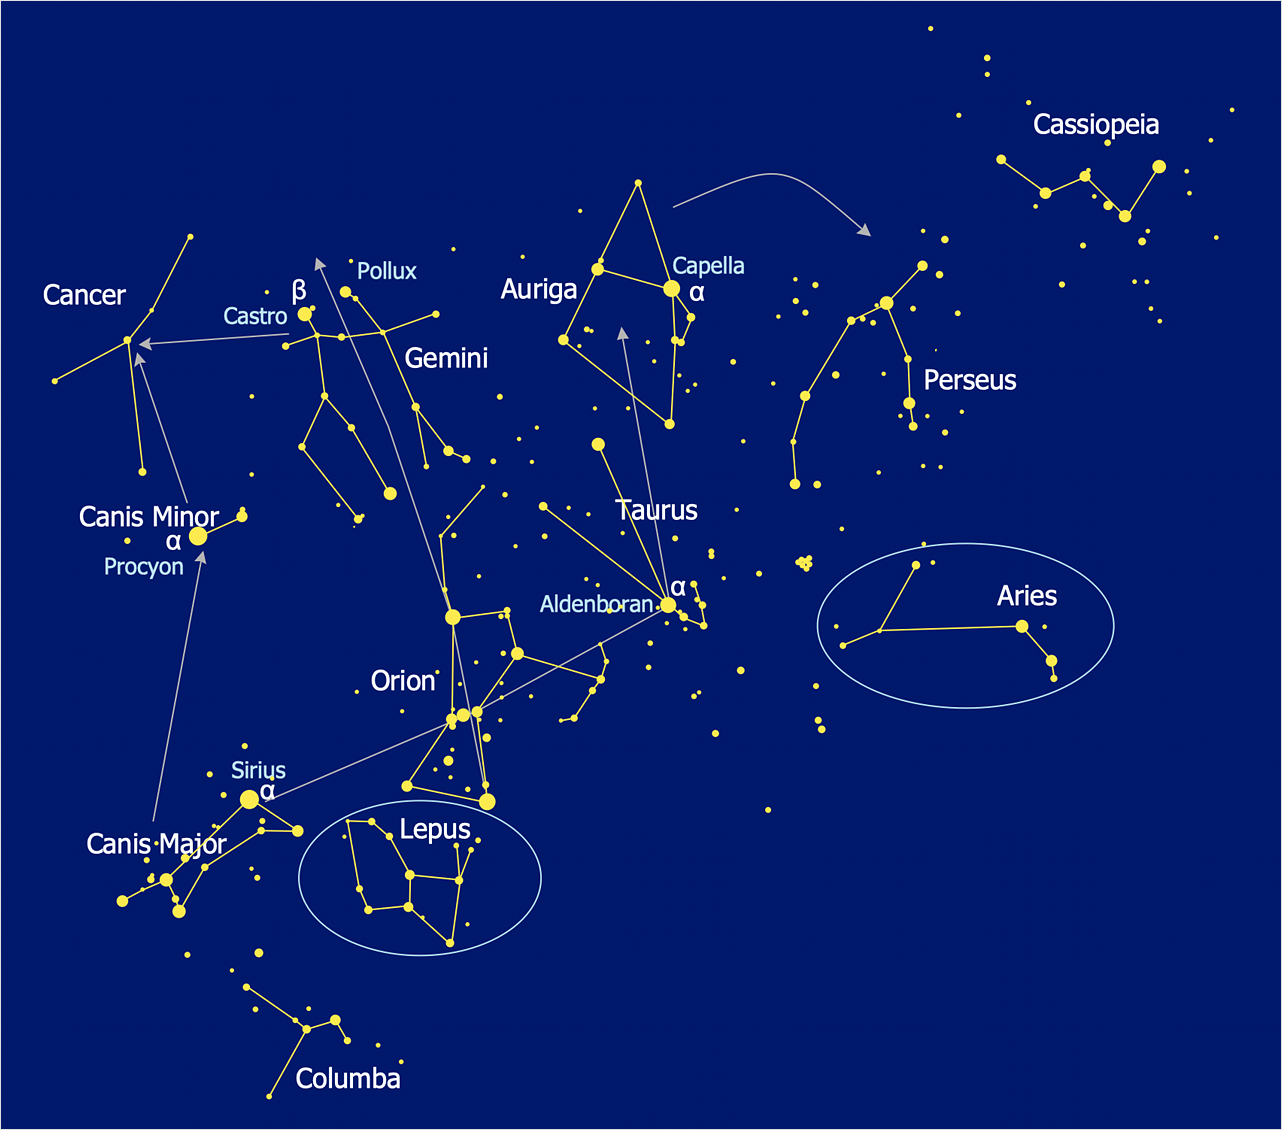
How to Draw a Сonstellation Сhart
Astronomic maps are used to locate stars, planets and other objects in the sky for a certain date, time and observing location. ConceptDraw Astronomy solution can be used as a tool for creating astronomy maps, charts and illustrations that contains astronomy symbols of constellations, galaxies, stars and planets. It allows you to draw the map of any constellation quickly and easily using the special templates and vector stencils libraries.HelpDesk
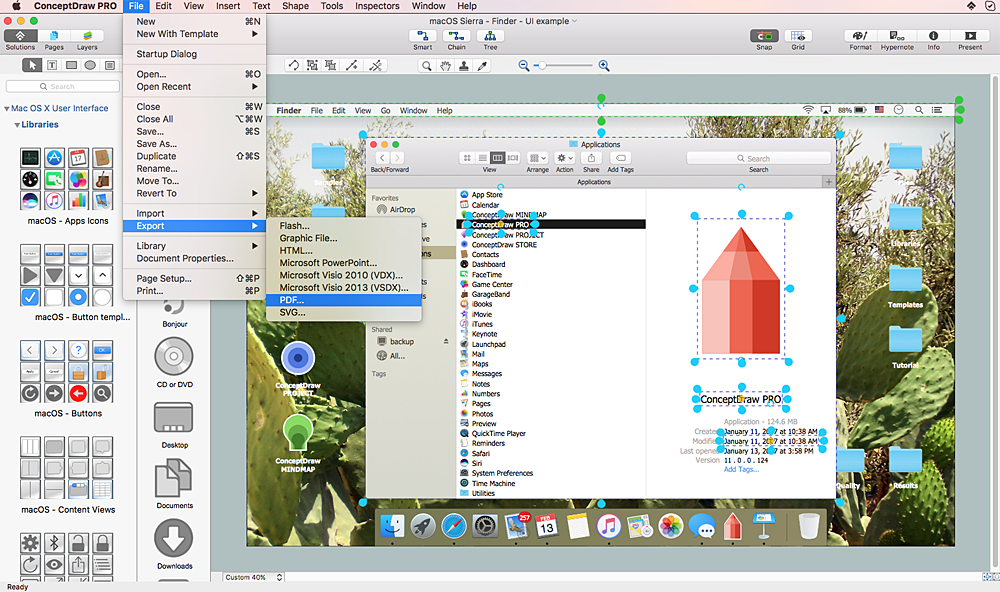
How to Design a Mockup of Apple macOS Sierra GUI
Since that first Macintosh, Apple has always developed and used their own hardware specific operating system. The fundamental style and layout of the Mac OS X user interface have remained largely in place since the earliest versions, but there have been obvious aesthetic enhancements, and elements of icon redesign to match branding across devices. To design an effective user interface, graphic designers will create visual GUI prototypes, that focus on maximizing the user experience. Uses Interface prototyping is much convenient when you can work through a diagram similar to the OS X design. ConceptDraw DIAGRAM allows you to develop Apple OS X User Interface (UI) prototypes using the special templates and vector libraries of the specific user interface elements. ConceptDraw Mac OS X UI solution offers libraries containing the distinct Mac app icons, menu bar graphics, glyph elements and other Mac OS X features — everything necessary to create a high standard, professional UI graphic design.HelpDesk
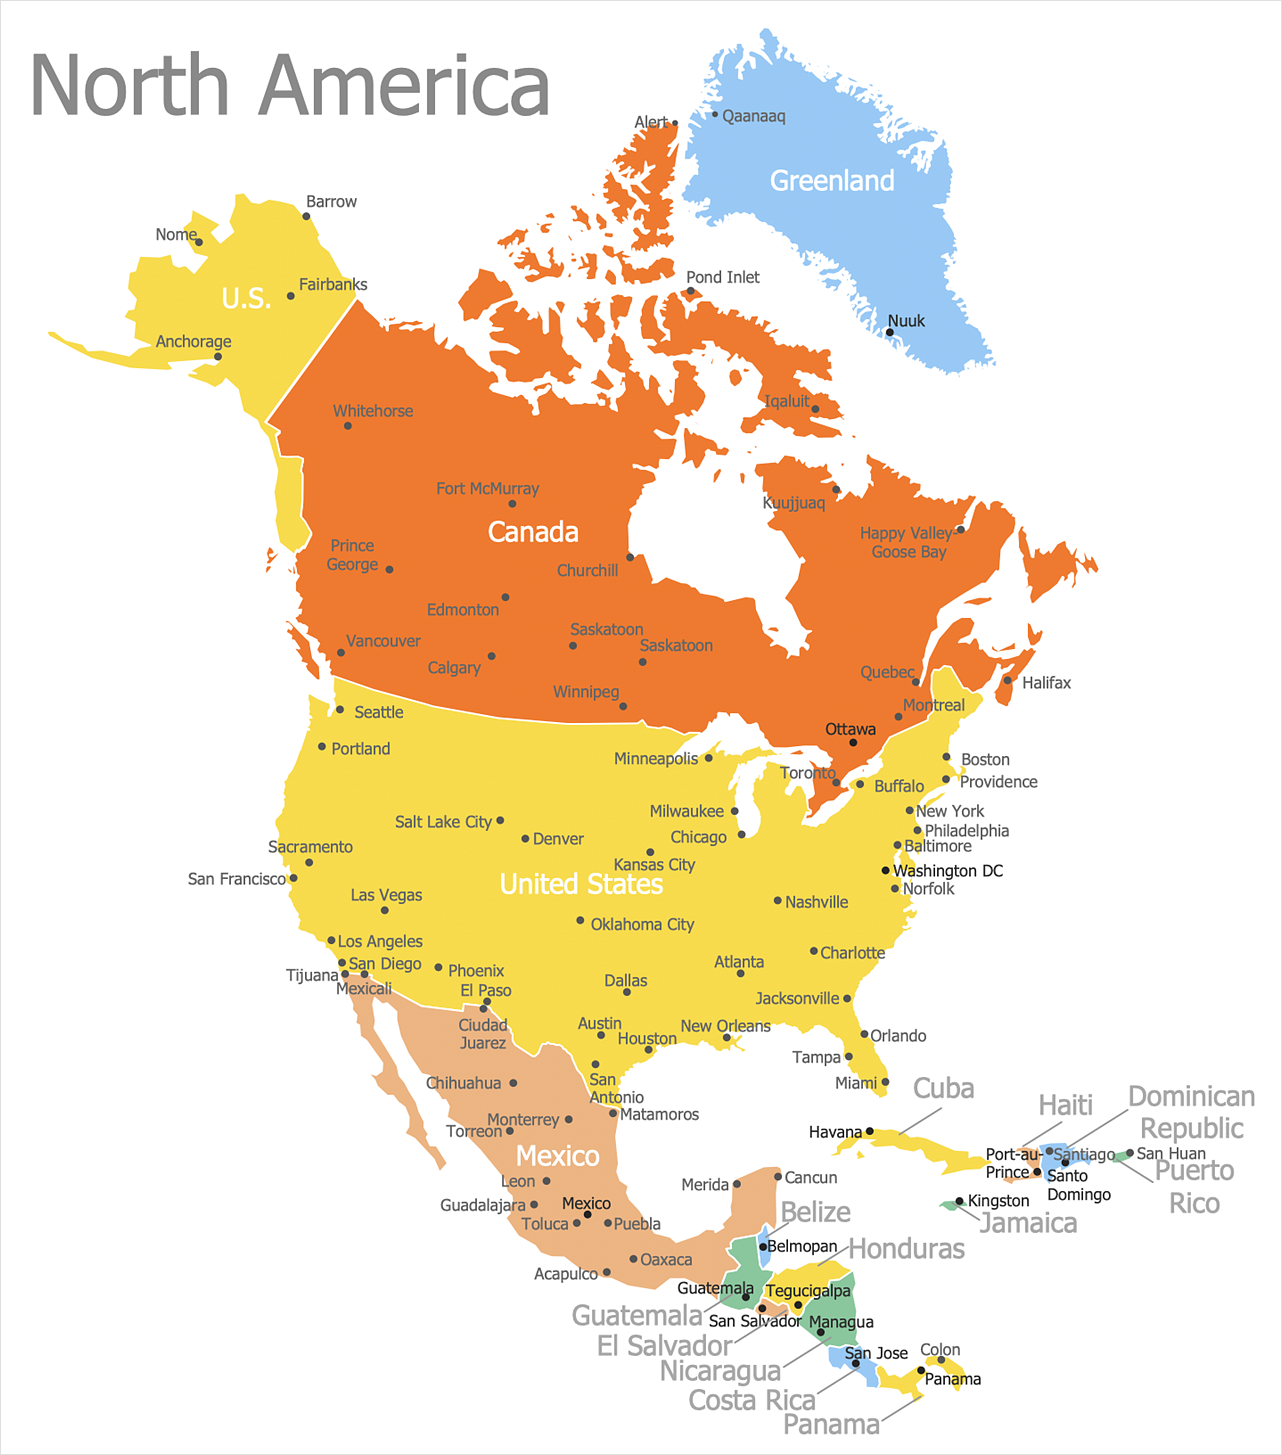
How to Draw a Map of North America
Geographic maps, cardiograms, and thematic maps are often used for geographical visualization of business information. Any country can inspire a wealth of geopolitical statistical data. A common way of assimilating this data is to create maps that convey a particular theme or subject matter in relation to a specific geographical area. Known as thematic maps, they cover themes such as population density, average rainfall, or political allegiance, differentiating the data by using graphical elements and annotation. Thematic maps contrast general reference maps, which tend to display information on a variety of subjects — vegetation, topology, roads, and highways, for example. A thematic map will always focus on one particular subject matter. ConceptDraw DIAGRAM can be helpful as a tool for creating maps of countries and regions of the world. It allows you to draw continental maps quickly and easily using the special templates and vector stencils libraries.- Android 5.0 - Lock screen notifications | How to Protect a ...
- Security and Access Plans | Security Plans | How to Draw a Security ...
- Network Security | Network Security Architecture Diagram | Network ...
- Network Security Diagrams | Network Security Devices | Network ...
- Cyber Security Degrees | IT Security Solutions | Network Security ...
- Organizational chart - University leadership | Organizational chart ...
- Network Security Diagrams | Cybersecurity - Vector stencils library ...
- ConceptDraw PRO Compatibility with MS Visio | Network Security ...
- Cyber Security Degrees | Network Security Diagrams | IT Security ...
- Abstract Of Non Return Valve
