 Divided Bar Diagrams
The Divided Bar Diagrams Solution extends the capabilities of ConceptDraw PRO v10 with templates, samples, and a library of vector stencils for drawing high impact and professional Divided Bar Diagrams and Graphs, Bar Diagram Math, and Stacked Graph.
Basic Flowchart Examples
ConceptDraw PRO is a business flowchart software includes the wide flowchart examples package.Competitor Analysis
Competitor analysis is a first and obligatory step in elaboration the proper corporate marketing strategy and creating sustainable competitive advantage. Use powerful opportunities of numerous solutions from ConceptDraw Solution Park for designing illustrative diagrams, charts, matrices which are necessary for effective competitor analysis.
 Timeline Diagrams
Timeline Diagrams solution extends ConceptDraw PRO software with templates, samples and library of vector stencils for drawing the timeline and milestones diagrams.
SWOT Matrix
SWOT matrix is a structured planning method used to evaluate the strengths, weaknesses, opportunities and threats involved in a project or in a business venture. ConceptDraw PRO diagramming and vector drawing software extended with SWOT and TOWS Matrix Diagrams Solution from the Management Area will help you design SWOT Matrix of any complexity quick and easy.Growth-Share Matrix Software
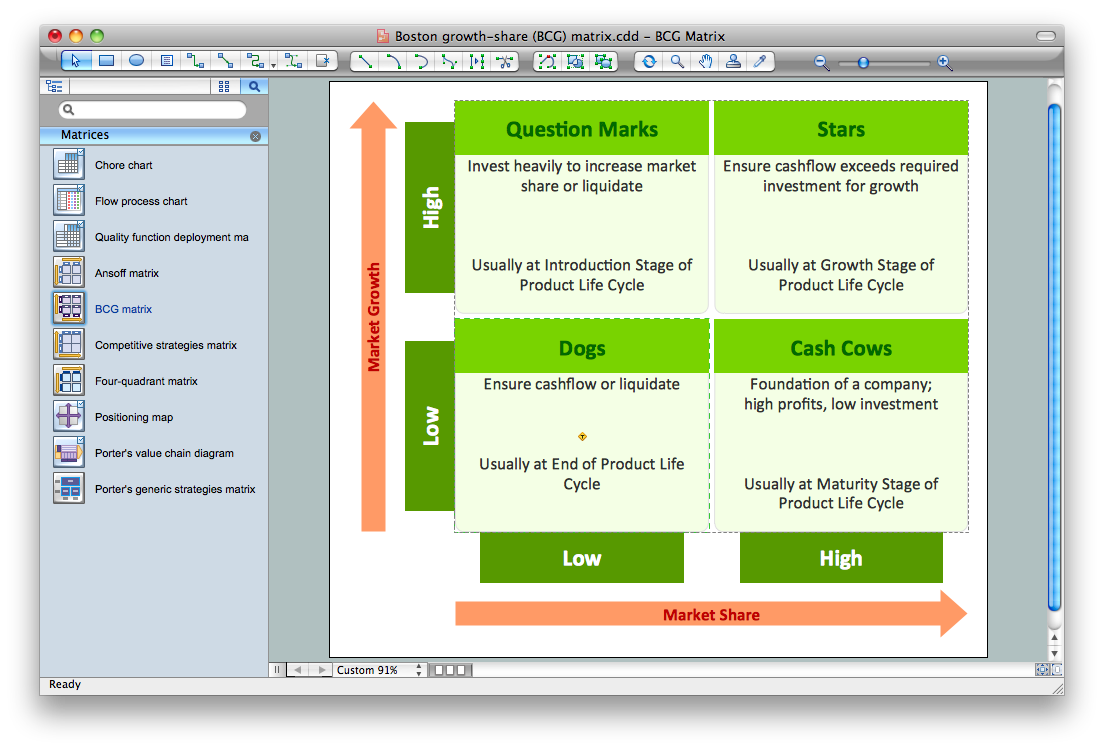
Growth-Share Matrix Software - ConceptDraw PRO is a powerful diagramming and vector drawing software for creating professional looking Growth–Share Matrices. For simple and quick creating the Growth–Share Matrix ConceptDraw PRO offers the Matrices Solution from the Marketing Area of ConceptDraw Solution Park. The Matrices Solution also provides a wide variety of templates and samples that will help you to create the Matrix diagrams of any difficulty.Quality Control Chart Software — ISO Flowcharting
Quality Control Chart Software (ISO Flowcharting) - ConceptDraw PRO extended with Total Quality Management TQM Diagrams Solution from the Quality Area is the best diagramming and vector drawing software that allows you to draw the quality control charts quick and easy. The quality control chart is a graphic that illustrates the accordance of processes or products to the intended specifications and degree of differences from them. Depending on what type of data you need analyze, there are used different types of quality control charts: X-bar charts, S charts, Np charts.Geo Map - South America - Nicaragua
Nicaragua, officially the Republic of Nicaragua, is the largest country in the Central American isthmus, bordering Honduras to the north and Costa Rica to the south. The vector stencils library Nicaragua contains contours for ConceptDraw PRO diagramming and vector drawing software. This library is contained in the Continent Maps solution from Maps area of ConceptDraw Solution Park.
 Australia Map
For graphic artists creating accurate maps of Australia. The Australia Map solution - allows designers to map Australia for their needs, offers a collection of scalable graphics representing the political geography of Australia, split into distinct state
PDPC
ConceptDraw PRO extended with Seven Management and Planning Tools Solution from the Management Area of ConceptDraw Solution Park is the best software for drawing all types of diagrams from the Seven Management and Planning Tools: Affinity Diagram, Relations Diagram, Prioritization Matrix, Root Cause Analysis Tree Diagram, Involvement Matrix, PERT Chart, and Risk Diagram (PDPC).
 Rapid UML
Rapid UML solution extends ConceptDraw PRO software with templates, samples and libraries of vector stencils for quick drawing the UML diagrams using Rapid Draw technology.
 USA Maps
Use the USA Maps solution to create a map of USA, a US interstate map, printable US maps, US maps with cities and US maps with capitals. Create a complete USA states map.
 Seven Management and Planning Tools
Seven Management and Planning Tools solution extends ConceptDraw PRO and ConceptDraw MINDMAP with features, templates, samples and libraries of vector stencils for drawing management mind maps and diagrams.
 Sales Flowcharts
The Sales Flowcharts solution lets you create and display sales process maps, sales process workflows, sales steps, the sales process, and anything else involving sales process management.
Geo Map - Europe - Greece
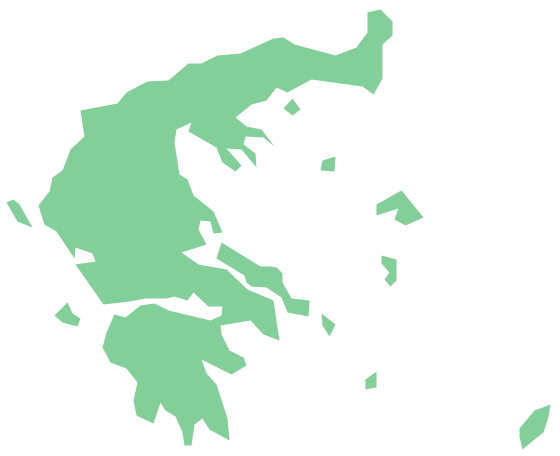
Greece is strategically located at the crossroads of Europe, Asia, and Africa. The vector stencils library Greece contains contours for ConceptDraw PRO diagramming and vector drawing software. This library is contained in the Continent Maps solution from Maps area of ConceptDraw Solution Park.- How to Draw a Divided Bar Chart in ConceptDraw PRO | Divided ...
- Chart Maker for Presentations | Divided Bar Diagrams | Divided bar ...
- Basic Divided Bar Diagrams | Competitor Analysis | Geo Map ...
- Divided Bar Diagrams | How To Create Restaurant Floor Plan in ...
- Grouped Bar Charts
- Diagramming Software for Design UML Communication Diagrams ...
- How to Draw a Divided Bar Chart in ConceptDraw PRO | Basic ...
- Pie Charts | Life cycle analysis - Ring chart | UK Map | Natural ...
- How To Divide Flowchart Into Two Pages
- Pyramid Diagram | Process Flowchart | Pyramid Diagram | Chart Of ...
- How to Draw the Different Types of Pie Charts | How to Create a Pie ...
- Feature Comparison Chart Software | Organizational Charts with ...
- Basic Diagramming | Basic Flowchart Symbols and Meaning | Bar ...
- Basic Diagramming | Mathematical Diagrams | Mathematics ...
- Authority Matrix Diagram Software | PROBLEM ANALYSIS ...
- 3 Circle Venn Diagram . Venn Diagram Example | Venn Diagram ...
- Venn Diagram Maker | Venn Diagram Examples for Problem Solving ...
- Basic Flowchart Symbols and Meaning | Venn Diagram Examples ...
- Example Of Maths Flow Chart
- How to Connect Text Data to a Time Series Chart on Your Live ...


