Bar Diagrams for Problem Solving. Create economics and financial bar charts with Bar Graphs Solution
Create bar graphs for visualizing economics problem solving and financial data comparison using the ConceptDraw DIAGRAM diagramming and vector drawing software extended with the Bar Graphs Solution from the Graphs and Charts area of ConceptDraw Solition Park.Bar Diagram Math
ConceptDraw DIAGRAM extended with Divided Bar Diagrams solution from Graphs and Charts area of ConceptDraw Solution Park is the best software for quick and simple drawing the Divided Bar Diagrams and Bar Diagram Math.Fishbone Problem Solving
The knowledge and ability to apply various strategies for dealing with problems and difficult situations is very useful in many areas. The Fishbone strategy is one of the most progressive. This graphical technique helps to identify possible causes of problems, to set the goals, and also show internal connections between the different parts of problem. After reviewing all causes and facts, you can easily find right solution. ConceptDraw DIAGRAM diagramming and vector drawing software extended with Fishbone Diagrams Solution from the Management Area of ConceptDraw Solution Park is a powerful Fishbone Problem Solving tool.8 Step Problem Solving
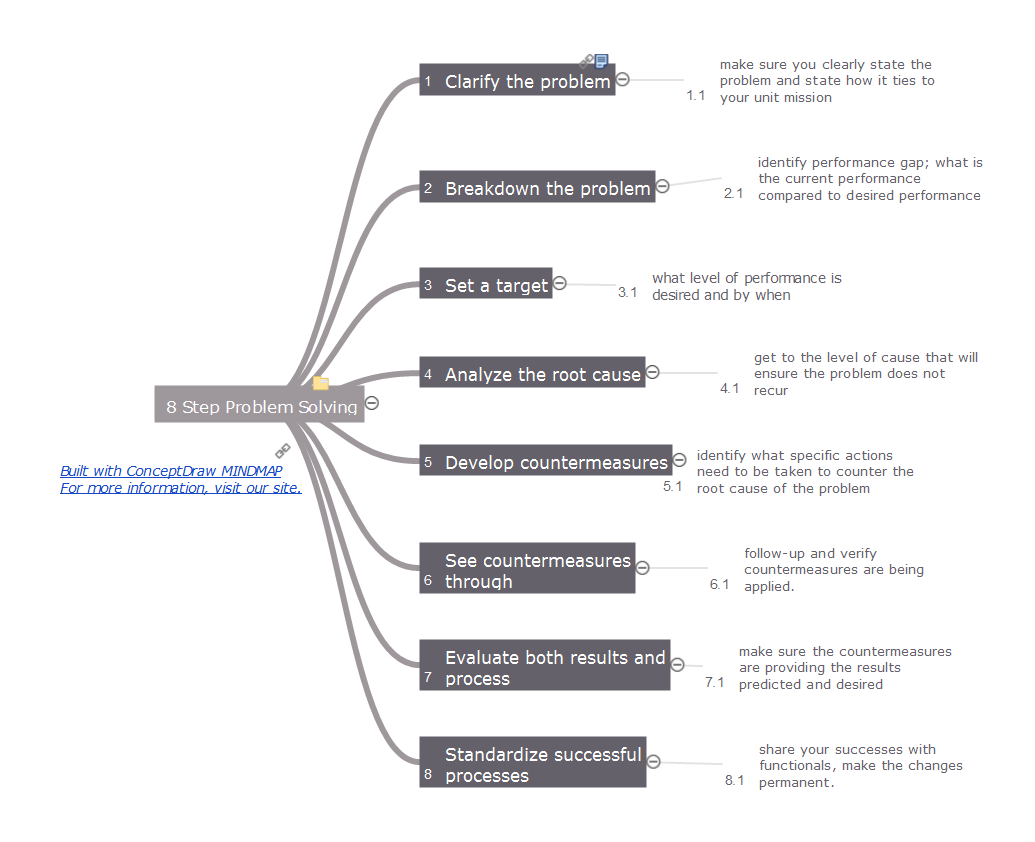
Time by time the problems appear in any field of our life and activities, and we can't to escape this. Any problem always has a certain content, the reasons and the circle of involved people. But the main task of any human, any organization, any company that was faced with a problem, is not to get lost and vice versa confidently look for the ways of solving this problem. The first you need to clarify the problem's essence, then to breakdown your problem and set a target. The most responsible step is to identify the cause-effect relationship, because each problem has its own root causes, and their detection will allow qualitatively solve this problem and avoid the similar problems in a future. Then you need to develop the countermeasures to counter the root cause of the problem and to make sure in their effectiveness, that they lead to the desired results. And finally standardize successful processes. This Mind Map designed with help of ConceptDraw MINDMAP software represents step-by-step the 8 steps approach of solving any kind of product or service problems.Rainfall Bar Chart
This sample shows the Horizontal Bar Chart of the average monthly rainfalls. This sample was created in ConceptDraw DIAGRAM diagramming and vector drawing software using the Bar Graphs Solution from the Graphs and Charts area of ConceptDraw Solution Park.Venn Diagram Examples for Problem Solving. Environmental Social Science. Human Sustainability Confluence
The Venn diagram example below shows sustainable development at the confluence of three constituent parts. Create your Venn diagrams for problem solving in environmental social science using the ConceptDraw DIAGRAM diagramming and vector drawing software extended with the Venn Diagrams solution from the area "Diagrams" of ConceptDraw Solution Park.BPR Diagram. Business Process Reengineering Example
This sample was created in ConceptDraw DIAGRAM diagramming and vector drawing software using the Business Process Diagram Solution from the Business Processes area of ConceptDraw Solution Park. The Business Process Solution is based on the standard BPMN 2.0 and includes the set of libraries of ready-to-use objects.Fundraising Pyramid
ConceptDraw Pyramid Diagram software allows drawing column charts using predesigned objects or drawing tool.TQM Diagram Tool
The Total Quality Management Diagram solution helps you and your organization visualize business and industrial processes. Create Total Quality Management diagrams for business process with ConceptDraw software.Percentage Pie Chart. Pie Chart Examples
This sample was created in ConceptDraw DIAGRAM diagramming and vector drawing software using the Pie Charts Solution from Graphs and Charts area of ConceptDraw Solution Park. This sample shows the Pie Chart of the approximate air composition. You can see the percentage of oxygen, nitrogen and other gases in the air visualized on this Pie Chart.- Bar Chart Or Bar Graph For Problem Solving
- Sales Growth. Bar Graphs Example | Bar Graphs | Bar Diagrams for ...
- Bar Graph Complete Solution
- Bar Graphs | Bar Graph | Bar Diagrams for Problem Solving . Create ...
- Bar Diagrams for Problem Solving . Create economics and financial ...
- Create Graphs and Charts | Sales Growth. Bar Graphs Example ...
- Bar Diagrams for Problem Solving . Create business management ...
- Bar Chart Examples | Bar Diagrams for Problem Solving . Create ...
- Bar Diagrams for Problem Solving . Create manufacturing and ...
- Venn Diagram Examples for Problem Solving . Environmental Social ...


