CORRECTIVE ACTIONS PLANNING. PERT Chart
The PERT Chart is constructed as part of the process in creating a schedule of corrective actions. The PERT Chart shows the logical connections and consequence of tasks to be performed. It displays the time period for problem solving and the implementation of all activities through the critical path. ConceptDraw Office suite is a software for corrective actions planning.
 Seven Management and Planning Tools
Seven Management and Planning Tools solution extends ConceptDraw DIAGRAM and ConceptDraw MINDMAP with features, templates, samples and libraries of vector stencils for drawing management mind maps and diagrams.
PROBLEM ANALYSIS. Prioritization Matrix
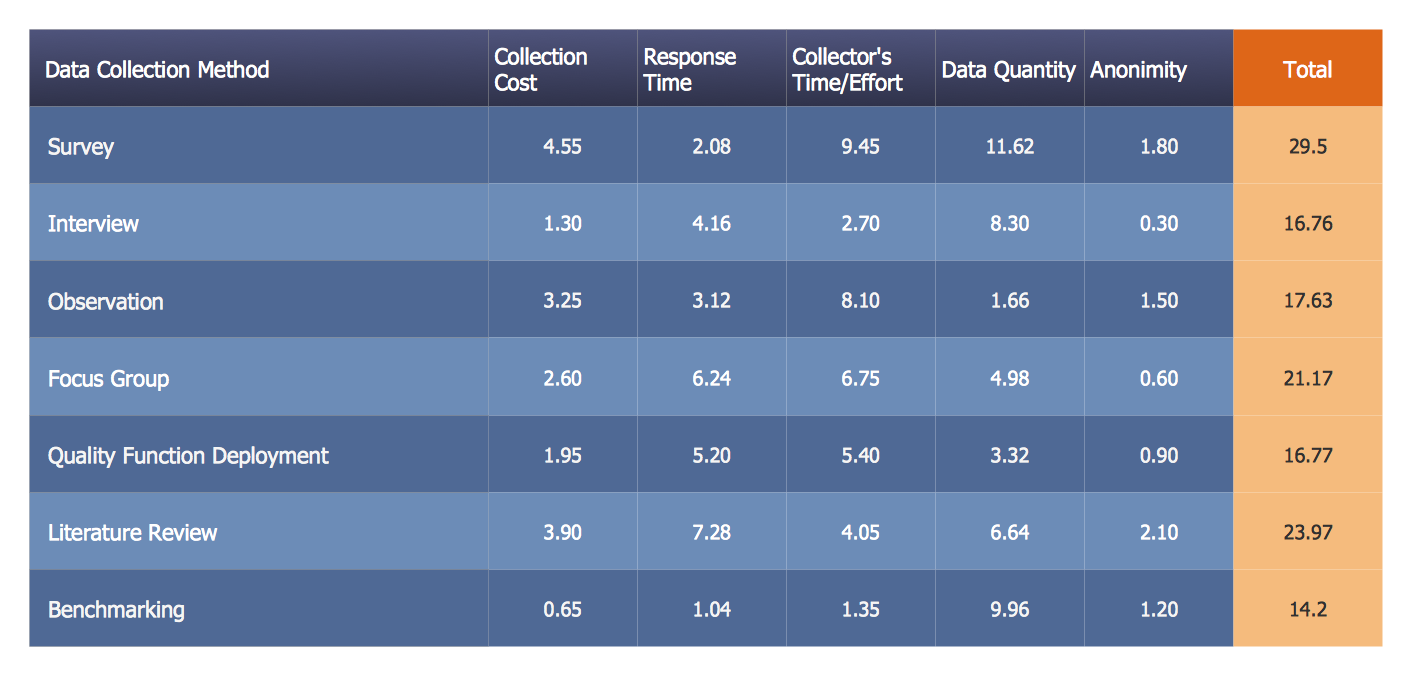
ConceptDraw OFFICE suite is a software for Prioritization Matrix diagram making. This diagram ranks the drivers’ factors to determine priority. It identifies the factors of the first priority for analysis of possible corrective actions. It assesses the weight of each factor for each criterion and specifies it in the Prioritization Matrix. The total sum of weights for a factor’s criteria indicates its priority.
 Seven Management and Planning Tools
Seven Management and Planning Tools solution extends ConceptDraw DIAGRAM and ConceptDraw MINDMAP with features, templates, samples and libraries of vector stencils for drawing management mind maps and diagrams.
Venn Diagram Examples for Problem Solving. Venn Diagram as a Truth Table
Venn diagrams are illustrations used in the branch of mathematics known as set theory. They show the mathematical or logical relationship between different groups of things (sets). A Venn diagram shows all the possible logical relations between the sets.ConceptDraw DIAGRAM
ConceptDraw DIAGRAM is a powerful business and technical diagramming software tool that enables you to design professional-looking graphics, diagrams, flowcharts, floor plans and much more in just minutes. Maintain business processes performance with clear visual documentation. Effectively present and communicate information in a clear and concise manner with ConceptDraw DIAGRAM.
 Management Area
The solutions from Management area of ConceptDraw Solution Park collect templates, samples and libraries of vector stencils for drawing the management diagrams and mind maps.
 ConceptDraw Solution Park
ConceptDraw Solution Park collects graphic extensions, examples and learning materials
Workflow Diagram
Workflow diagram is a perfect tool to represent visually a repeatable pattern of organizational activity that is powered by resources and to describe in details the transferring of data, documents or tasks during a work process. It effectively explains and documents the process flow that exists and that requires the studying, analyzing and execution. Workflow diagrams help to represent the working processes in a simple visual manner, to follow easy the path of a task in a workflow, to identify the persons responsible for the execution of each stage, to show the accompanied documents and needed resources. All this helps to optimize the workflow and to discover its weak points. Workflow diagrams are mainly designed and used as a part of project documentation, certification process and company policies to comply the standards. To design professionally the Workflow diagrams, use the ConceptDraw DIAGRAM software. Enhanced with Workflow Diagrams solution from the Business Processes area, the ConceptDraw DIAGRAM it is a powerful workflow diagram maker.- Program Evaluation and Review Technique ( PERT ) with ...
- Seven Management and Planning Tools | PERT chart - Sale ...
- CORRECTIVE ACTIONS PLANNING. PERT Chart | Program ...
- Program Evaluation and Review Technique ( PERT ) with ...
- PROBLEM ANALYSIS Prioritization Matrix | PROBLEM ANALYSIS ...
- Solve Pert Diagram
- Root cause analysis tree diagram - Sale problem solution
- Decision Making Problem Analysis And Solving
- Process Flowchart | Activity on Node Network Diagramming Tool ...
- Seven Management and Planning Tools | Problem solving | Seven ...
- Activity on Node Network Diagramming Tool | Network Analysis ...
- Activity Network ( PERT ) Chart | Activity Network Diagram Method ...
- Corrective Action Planning
- Fishbone Problem Solving | Venn Diagram Examples for Problem ...
- PROBLEM ANALYSIS . Root Cause Analysis Tree Diagram | Root ...
- Using Fishbone Diagrams for Problem Solving | Bar Diagrams for ...
- Bar Diagrams for Problem Solving . Create economics and financial ...
- How To Create Root Cause Analysis Diagram | PROBLEM ...
- Cause and Effect Analysis (Fishbone Diagrams) | PROBLEM ...
- Bar Diagrams for Problem Solving . Create manufacturing and ...


