When To Use a Fishbone Diagram
Fishbone diagrams work for most entrepreneurs and almost any industry or person having a problem. Professional diagramming software may help you create Fishbone (Cause and Effect or Ishikawa) diagrams. When people are unclear about what is causing an issue, ConceptDraw DIAGRAM will be your lifesaver. When to use a Fishbone diagram? Originally developed as a quality control tool, you may find a Fishbone diagram helpful when used in many cases, such as to analyze a complex problem when there are many causes, for identifying all possible root causes for an effect or a problem, when you need different point of view to look on a problem, to uncover bottlenecks and identify where and why a process doesn't work, for acceleration a process when traditional ways of problem solving consume many time.HelpDesk
How to Create a Fishbone (Ishikawa) Diagram Quickly
A Fishbone (Ishikawa) diagram is also called cause-and-effect diagram. Fishbone diagram is often used in business to determine the cause of some problem. The diagram illustrates the main causes and sub-causes leading to an event. The main goal of the Fishbone diagram is to illustrate in a graphical way the relationship between a given outcome and all the factors that influence this outcome. The complete diagram resembles a fish skeleton as its name implies. The ability to create a Fishbone Diagram is supported by the Fishbone Diagram solution. Use ConceptDraw MINDMAP for structuring data and then ConceptDraw DIAGRAM for generating a Fishbone Diagram from mind map structure.
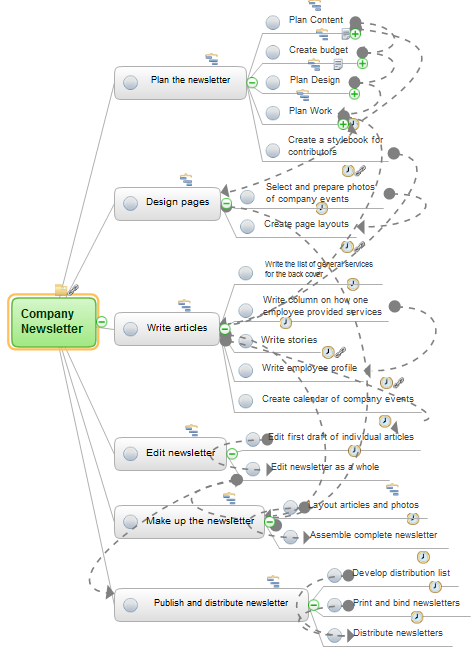
 Quality Mind Map
This solution extends ConceptDraw MINDMAP software with Quality Management Mind Maps (Presentations, Meeting Agendas, Problem to be solved).
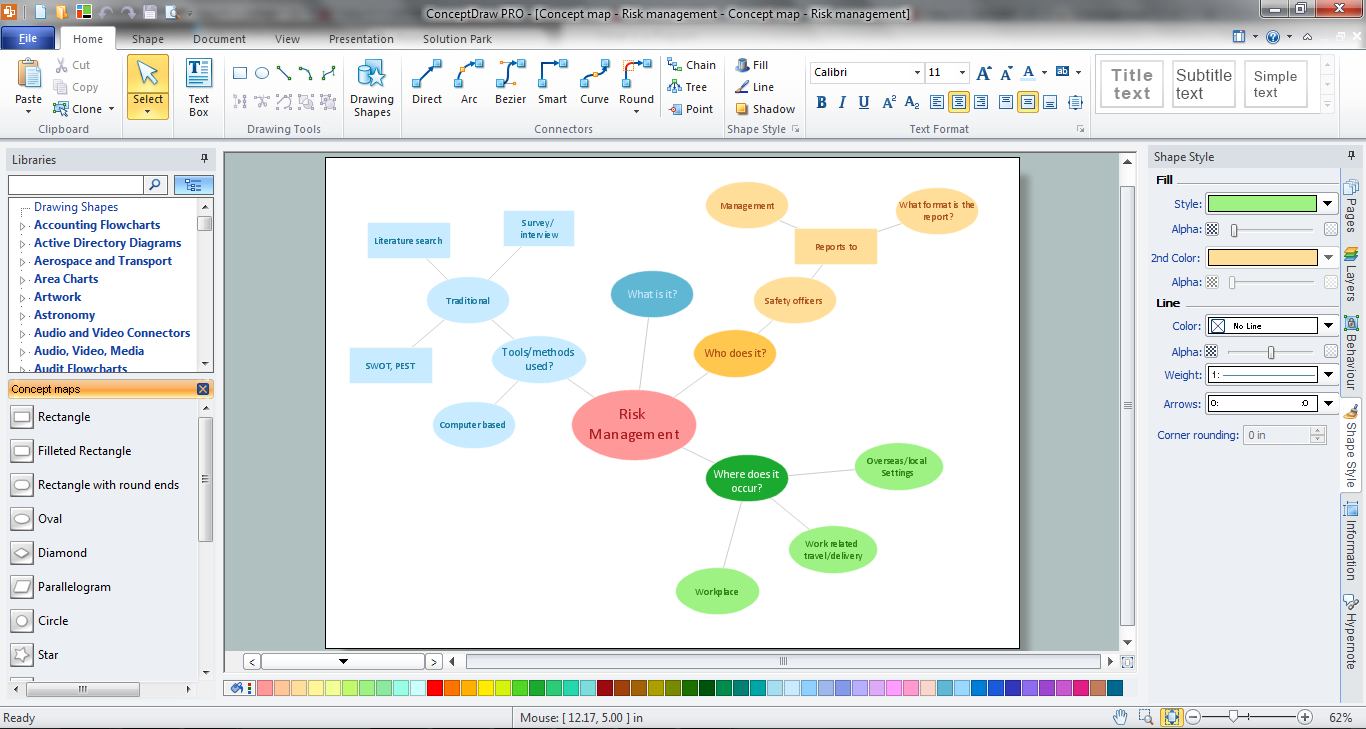
How To Make a Concept Map
How to make a Concept Map fast and easy? ConceptDraw DIAGRAM diagramming and vector drawing software extended with Concept Maps Solution from the "Diagrams" Area is the best choice for those who want design professional looking Concept Map in minutes.Presentation Preparation using Mind Maps
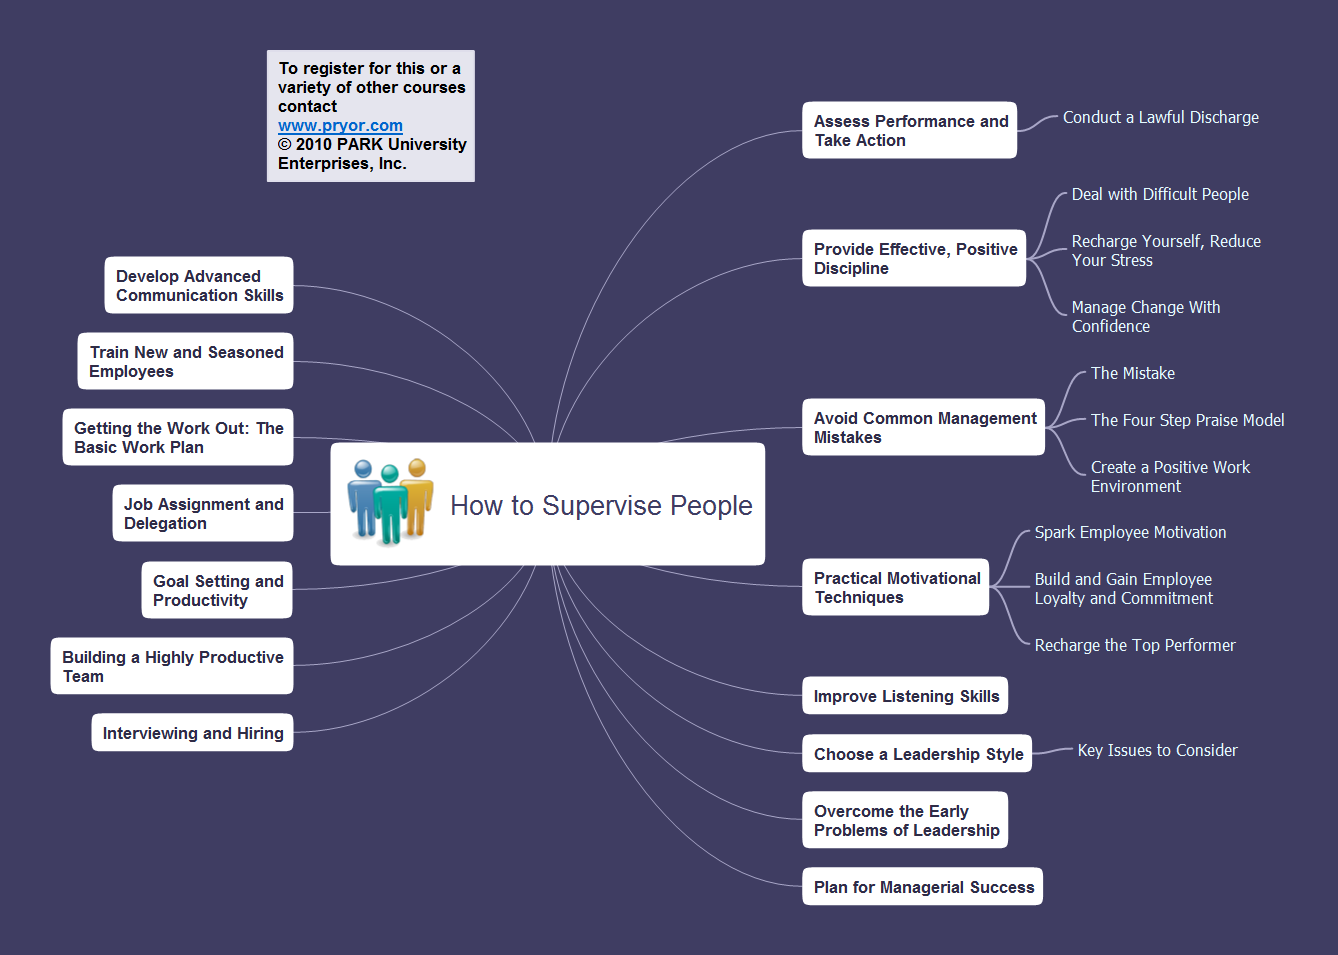
Whenever you need quick presentations, the ability to choose specific content, the ability to focus on specific stakeholder needs, update data, or create polished slide decks — ConceptDraw MINDMAP provides a presentation solution for you.ConceptDraw MINDMAP : Brainstorming, Mind Mapping for macOS and Windows
ConceptDraw MINDMAP is a powerful business and personal productivity software application that provides visual organization and access to information for individuals and organizations.Think and act effectively
Many people who use mind mapping software for personal organizing find ConceptDraw MINDMAP sufficiently useful mind mapping tool in their business and daily life. Especially many positive responses receive ConceptDraw MINDMAP as cross platform tool to mind maps for Macintosh and Windows.Mind Maps for Business - SWOT Analysis
SWOT analysis is a planning method and the best way for effective exploring four major aspects for a business or a venture - strengths, weaknesses, opportunities and threats. Visually SWOT analysis results are depicted as a SWOT matrix, diagram or Mind Map, which is then included to the set of documents, report or in presentation devoted to demonstration the results of realized SWOT analysis for directors, shareholders, and other interested employees. ConceptDraw Solution Park includes the SWOT and TOWS Matrix Diagrams solution, which offers wide possibilities for realization SWOT analysis and creation SWOT Matrices and SWOT Mind Maps in ConceptDraw DIAGRAM and ConceptDraw MINDMAP software. This solution includes fully ready-to-use SWOT vector design elements, SWOT matrix samples and also useful templates that allow users create own SWOT diagrams and Mind Maps for business SWOT analysis in a few minutes. Use also the perfect ability of instantly exporting to various formats and of creation MS PowerPoint presentation right from the ConceptDraw applications.HelpDesk
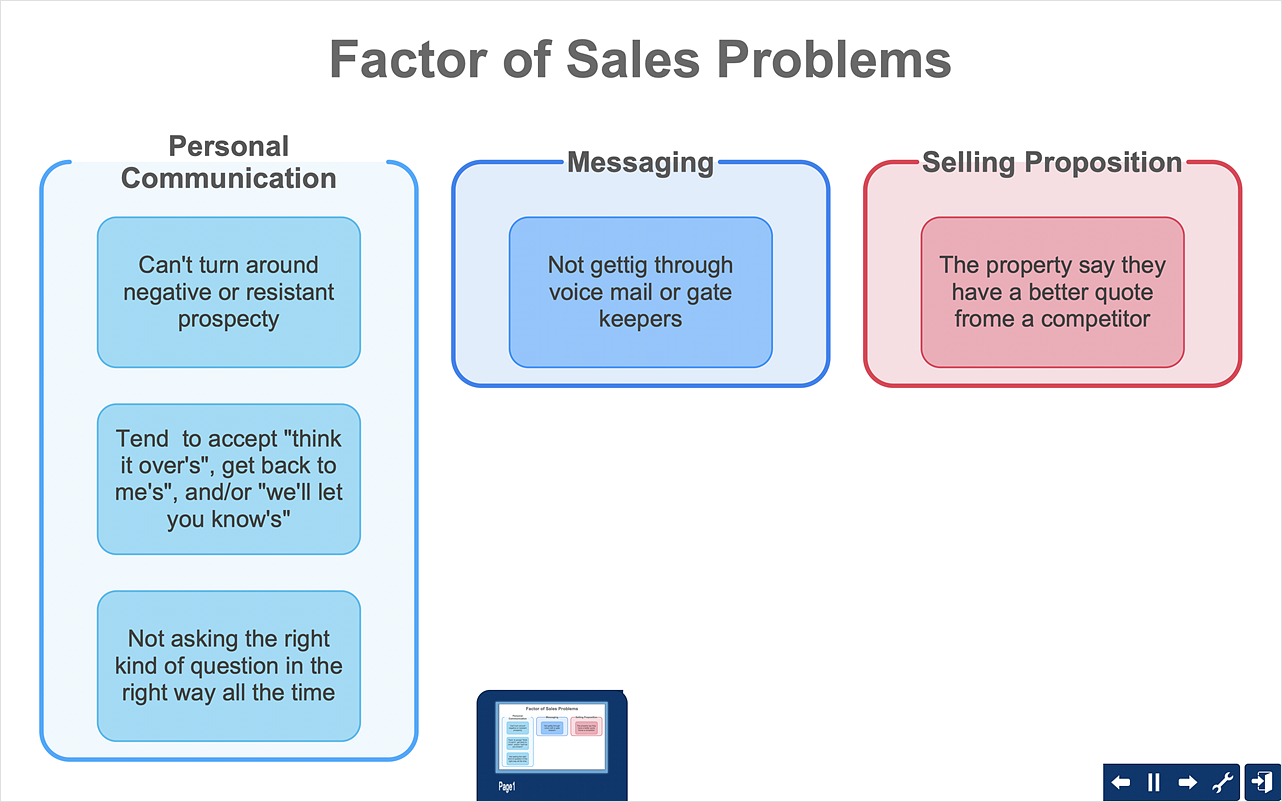
How To Create an Affinity Diagram Using Solutions
Affinity diagram is designed to prepare the data for further analysis of the cause-effect relationships.The Affinity diagram shows the structure of large, complex factors that have an influence on a problem, and then divides them up into a smaller and simpler structure. We recommend using a mind map for Brainstorming and collecting the factors affecting the problem. The ability to create an Affinity diagram from a mind map is supported by the ConceptDraw Seven Management and Planning Tools solution.- Conceptdraw.com: Mind Map Software, Drawing Tools | Project ...
- Fish Bone Mind Map
- How to Insert a Mind Map into Microsoft Word Document | Concept ...
- How to Use the Export To PowerPoint Function in Your Mindmap ...
- Creating Relationship Diagram Mindmap
- How To Make a Concept Map | How to Start Mind Mapping from a ...
- Steps in the Accounting Process | How To Do A Mind Map In ...
- Mind Map Organizational Chart
- How To Create Root Cause Analysis Diagram Using ConceptDraw ...
- How to Add a Concept Map to a PowerPoint Presentation Using ...


