HelpDesk
How to Create a VSM Diagram Using Solutions
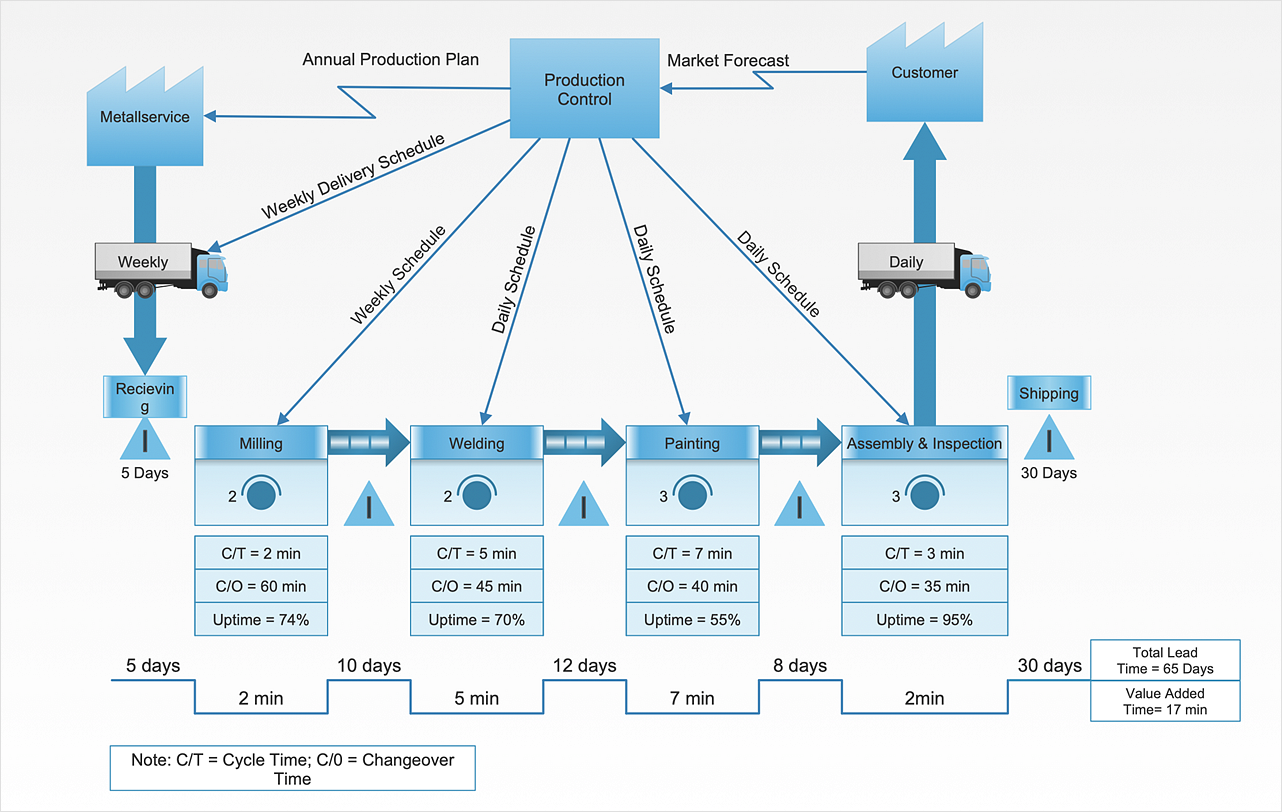
Value Stream Mapping is a Lean Manufacturing tool that uses a flow diagram to document in great detail every step of a manufacturing process. This graphical representation of a process is a powerful tool that helps in the diagnosis of process efficiency and allows companies to develop improved processes. Many lean practitioners use Value Stream Mapping as a fundamental tool to identify waste, cut process cycle times, and implement process improvement. Many organizations use value stream mapping as a key portion of their lean efforts. Value Stream Maps are used to analyze and design the flow of materials and information required to bring a product or service to a consumer. You can create a Value Stream Mapping flowchart using ConceptDraw DIAGRAM tools.Business diagrams & Org Charts with ConceptDraw DIAGRAM
The business diagrams are in great demand, they describe the business processes, business tasks and activities which are executed to achieve specific organizational and business goals, increase productivity, reduce costs and errors. They let research and better understand the business processes. ConceptDraw DIAGRAM is a powerful professional cross-platform business graphics and business flowcharting tool which contains hundreds of built-in collections of task-specific vector stencils and templates. They will help you to visualize and structure information, create various Business flowcharts, maps and diagrams with minimal efforts, and add them to your documents and presentations to make them successful. Among them are Data flow diagrams, Organization charts, Business process workflow diagrams, Audit flowcharts, Cause and Effect diagrams, IDEF business process diagrams, Cross-functional flowcharts, PERT charts, Timeline diagrams, Calendars, Marketing diagrams, Pyramids, Target diagrams, Venn diagrams, Comparison charts, Analysis charts, Dashboards, and many more. Being a cross-platform application, ConceptDraw DIAGRAM is very secure, handy, free of bloatware and one of the best alternatives to Visio for Mac users.
 Quality Mind Map
This solution extends ConceptDraw MINDMAP software with Quality Management Mind Maps (Presentations, Meeting Agendas, Problem to be solved).
 Workflow Diagrams
Workflow Diagrams solution extends ConceptDraw DIAGRAM software with samples, templates and vector stencils library for drawing the work process flowcharts.
- Draw Waste Materials Diagrams With Charts
- Waste Material Diagram
- Waste Flow Chart
- Process Flow Chart | How To Make Water Cycle With Waste Material
- Material Requisition Flowchart. Flowchart Examples | Process ...
- Flow chart Example. Warehouse Flowchart | Material Requisition ...
- Life cycle analysis - Ring chart | Community life cycle matrix - Ring ...
- Pie Charts | Life cycle analysis - Ring chart | UK Map | Natural ...
- Rainfall Bar Chart | Pie Graph Worksheets | Percentage Pie Chart ...
- Flow chart Example. Warehouse Flowchart | Material Requisition ...
- Pie Chart Software | How to Draw the Different Types of Pie Charts ...
- Conventional Flow Chart
- Conventional Flow Chart Diagram
- Process Flowchart | Circular arrows diagram - PDCA cycle | Flow ...
- Process decision program chart (PDPC) - Personal activity | Process ...
- Example Of Pie Chart Of Recycled Material
- Basic Flowchart Symbols and Meaning | Block Diagrams | Top 5 ...
- Chart For Manufacturing Process
- Pie Charts | Design elements - Pie charts | Pie Chart Software ...
- Flow Chart Concept Map Of Waste Management

