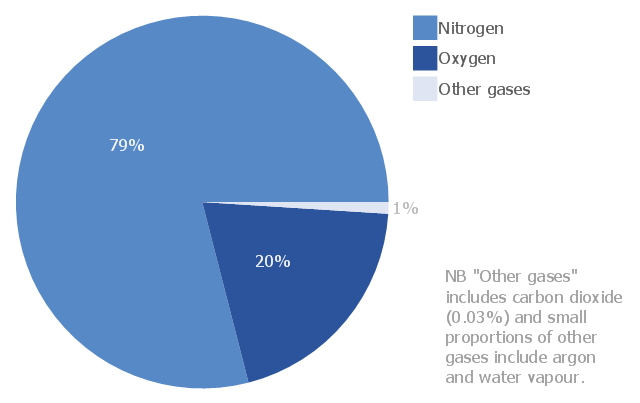
This pie chart sample shows the atmosphere air composition. It was designed on the base of the Wikimedia Commons file: Air composition pie chart.JPG.
[commons.wikimedia.org/ wiki/ File:Air_ composition_ pie_ chart.JPG]
This file is licensed under the Creative Commons Attribution-Share Alike 3.0 Unported license. [creativecommons.org/ licenses/ by-sa/ 3.0/ deed.en]
"The atmosphere of Earth is a layer of gases surrounding the planet Earth that is retained by Earth's gravity. The atmosphere protects life on Earth by absorbing ultraviolet solar radiation, warming the surface through heat retention (greenhouse effect), and reducing temperature extremes between day and night (the diurnal temperature variation).
The common name given to the atmospheric gases used in breathing and photosynthesis is air. By volume, dry air contains 78.09% nitrogen, 20.95% oxygen, 0.93% argon, 0.039% carbon dioxide, and small amounts of other gases. Air also contains a variable amount of water vapor, on average around 1%. Although air content and atmospheric pressure vary at different layers, air suitable for the survival of terrestrial plants and terrestrial animals currently is only known to be found in Earth's troposphere and artificial atmospheres." [Atmosphere of Earth. Wikipedia]
The pie chart example "Atmosphere air composition" was created using the ConceptDraw PRO diagramming and vector drawing software extended with the Pie Charts solution of the Graphs and Charts area in ConceptDraw Solution Park.
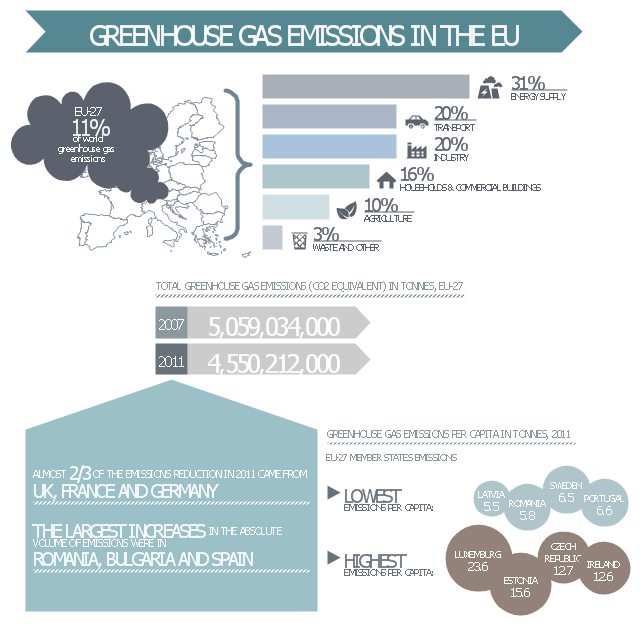
This ecology infographic example was created on the base of the infographics "Greenhouse gas emissions in the EU" from the Debating Europe website. [debatingeurope.eu/ wp-content/ uploads/ 2013/ 06/ TH_ 2_ social.png]
"A greenhouse gas (sometimes abbreviated GHG) is a gas in an atmosphere that absorbs and emits radiation within the thermal infrared range. This process is the fundamental cause of the greenhouse effect. The primary greenhouse gases in the Earth's atmosphere are water vapor, carbon dioxide, methane, nitrous oxide, and ozone. Greenhouse gases greatly affect the temperature of the Earth; without them, Earth's surface would average about 33 °C colder, which is about 59 °F below the present average of 14 °C (57 °F)." [Greenhouse gas. Wikipedia]
The ecology infographic example "EU greenhouse gas emissions" was created using the ConceptDraw PRO diagramming and vector drawing software extended with the Management Infographics solition from the area "Business Infographics" in ConceptDraw Solution Park.
Used Solutions
- Atmosphere air composition | Percentage Pie Chart. Pie Chart ...
- Drawing Illustration | Atmosphere air composition | Aerospace ...
- Examples Of Water Vapor
- Water cycle diagram | Drawing Illustration | Drawing a Nature ...
- Water cycle diagram | Drawing Illustration | Beauty in nature ...
- How To Draw Pie Chart For Gases In Atmosphere
- Atmosphere air composition | Interior Design Seating Plan - Design ...
- Draw A Pie Chart According To The Gases Of The Atmosphere
- Atmosphere air composition | Draw A Pie Chart Of Greenhouse Gases
- How to Draw a Line Chart Quickly | Atmosphere air composition ...
- Approximate composition of the air - Pie chart | Draw Pie Chart ...
- Atmosphere air composition | Pie Graph Worksheets | Pie Chart ...
- Water cycle diagram | Drawing a Nature Scene | Drawing Illustration ...
- How To Draw A Pie Graph Of The Atmosphere
- Water cycle diagram | Drawing a Nature Scene | Nature | Flow ...
- Water cycle diagram | Sea Water Vapor Png Clipart
- Water cycle diagram | Drawing Illustration | Nature Clipart and ...
- Water cycle diagram | Drawing a Nature Scene | Drawing Illustration ...
- Water cycle diagram | Draw A Flow Chart Describing Hydrologic Circle
- Drawing On Nature Earth

