HelpDesk
How to Create a Sales Dashboard Using ConceptDraw PRO
Visual dashboard is a valuable tool for any sales team. Sales dashboard allows you to view and monitor sales indicators that are important for manager and sales staff . It helps to use the timely and reliable information to improve the quality of sales performance and increase sales revenues. ConceptDraw Sales Dashboard solution is a tool for both: sales manager and sales team. It provides the visualization of key performance indicators that are critical to the entire sales organization. The custom sales dashboard displays the real-time information on sales performance KPIs with the help of intuitive and easy-to-understand diagrams and charts.
HelpDesk
How to Use ConceptDraw Dashboard for Facebook on PC
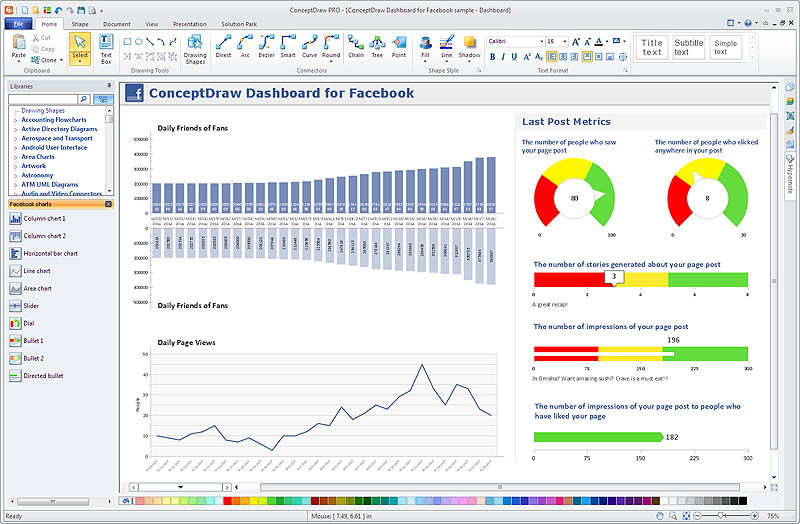
The ConceptDraw Dashboard for Facebook Solution is a visual dashboard that visualizes lifetime total Likes, daily Friends of Fans, and daily Page views based on the information exported from your Facebook Page.
 Sales Dashboard
Sales Dashboard solution extends ConceptDraw PRO software with templates, samples and library of vector stencils for drawing the visual dashboards of sale metrics and key performance indicators (KPI).
HelpDesk
How to Export Project Data to MS Excel Worksheet
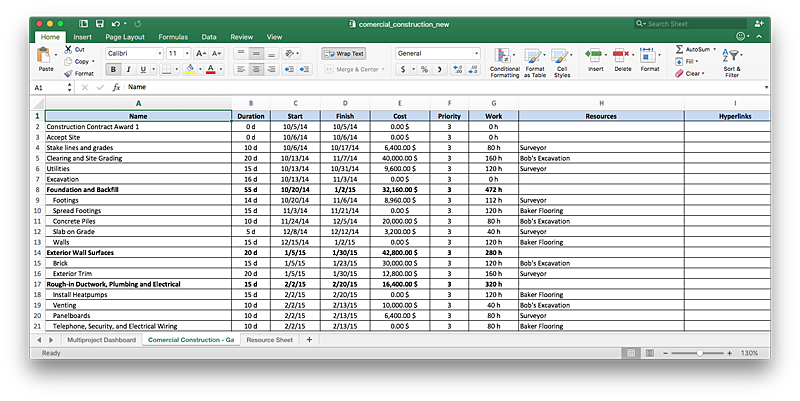
You can share your ConceptDraw PROJECT files with colleagues who use MS Excel®using the export capabilities of ConceptDraw PROJECT.HelpDesk
How to Use ConceptDraw Dashboard for Facebook on OS X
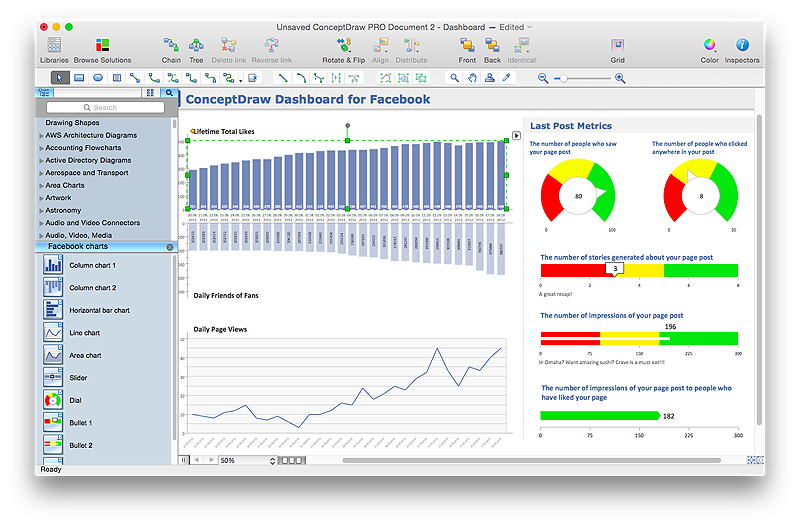
The ConceptDraw Dashboard for Facebook Solution is a visual dashboard that visualizes lifetime total Likes, daily Friends of Fans, and daily Page views based on the information exported from your Facebook Page.
 Time Series Dashboard
Time series dashboard solution extends ConceptDraw PRO software with templates, samples and vector stencils libraries with charts, graphs and plots for drawing the visual dashboards showing data time series.
 Fault Tree Analysis Diagrams
This solution extends ConceptDraw PRO v9.5 or later with templates, fault tree analysis example, samples and a library of vector design elements for drawing FTA diagrams (or negative analytical trees), cause and effect diagrams and fault tree diagrams.
HelpDesk
How to Track Your Project Plan vs. the Actual Project Condition
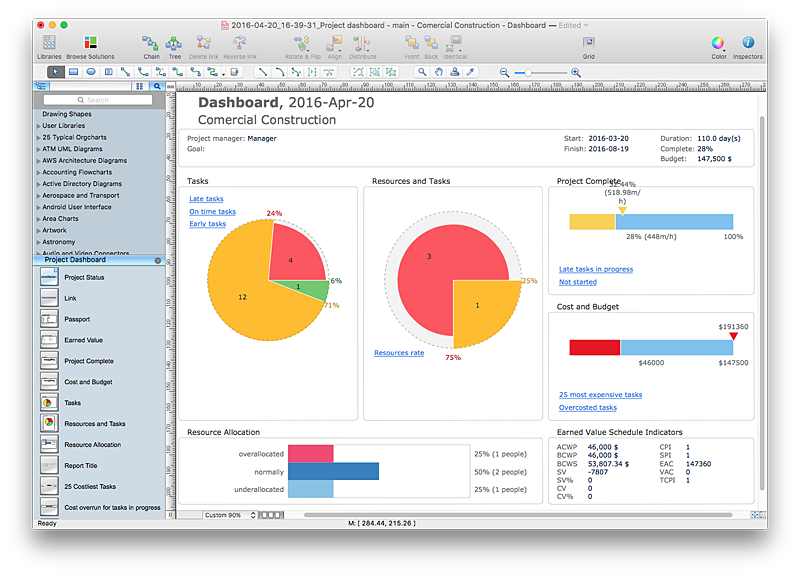
Conceptdraw PROJECT provides user with the possibility to track how the project is going. Project Manager can compare the actual data with the planned and assess possible measures to resolve issues. Conceptdraw PROJECT has several types of visual reports that can help to assess visually the difference between planned and actual project data.HelpDesk
How to Import Project Data From MS Excel Worksheet
You can import information into the project from MS Excel workbook using the entered fields - fields in which you can enter or edit information as opposed to calculated fields.
 Soccer
The Soccer (Football) Solution extends ConceptDraw PRO v9.5 (or later) software with samples, templates, and libraries of vector objects for drawing soccer (football) diagrams, plays schemas, and illustrations. It can be used to make professional looking
 Meter Dashboard
Meter dashboard solution extends ConceptDraw PRO software with templates, samples and vector stencils library with meter indicators for drawing visual dashboards showing quantitative data.
 Status Dashboard
Status dashboard solution extends ConceptDraw PRO software with templates, samples and vector stencils libraries with graphic indicators for drawing the visual dashboards showing status data.
 PM Planning
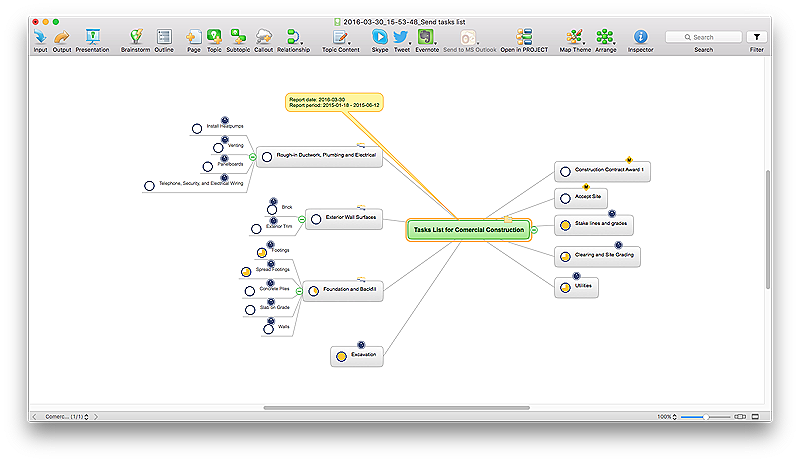
This solution extends ConceptDraw MINDMAP and ConceptDraw Project software, allowing you to automatically create documents that reflect a project's status, for people who have different project roles.
HelpDesk
How to Generate ConceptDraw PROJECT Standard Reports on Mac
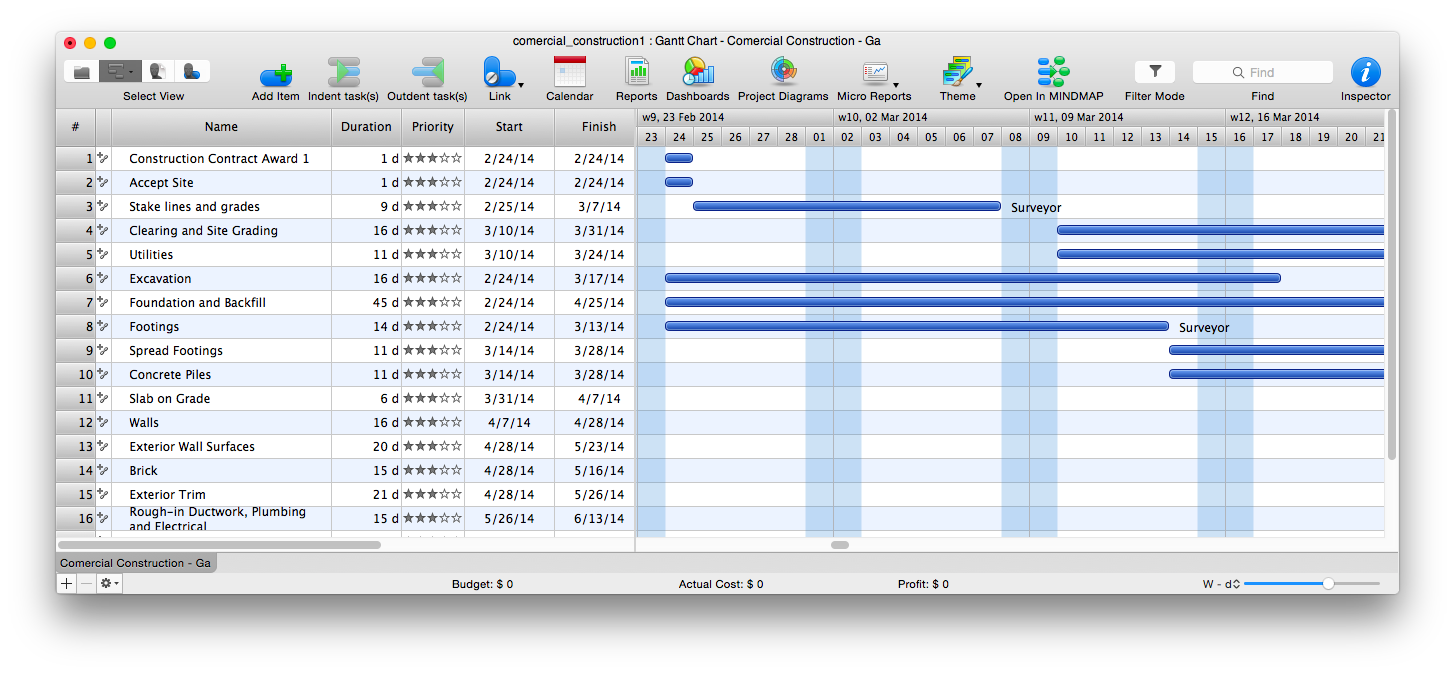
Project reporting is one of the key functions of effective project management. Using regular project reports, project manager can constantly track and analyze the project’s execution. This analytic process can help to ensure that the team reaches the best possible solutions. ConceptDraw PROJECT is a professional software tool for project management with the advanced mechanism of reporting. You can create the set of regular reports on project activities, task statuses, cash flow and assignments in MS Excel format. Mind map reports are also available.- Projects HR dashboard | Competitor Analysis | BCG Matrix | Project ...
- Status Dashboard | Projects HR dashboard | Project tasks ...
- Hr Analytics Dashboard Excel Free Download
- Balanced Scorecard Example Excel
- Employee Performance Dashboard In Excel
- Key Performance Dashboard Excel
- Status Dashboard | How To Create Project Report | PM Dashboards ...
- Employee distribution - HR dashboard | Projects HR dashboard ...
- Sales KPIs - Performance dashboard | Sales geographically ...
- Employee Performance Dashboard Template In Excel
- HR dashboard
- Enterprise dashboard | Balanced Scorecard Software | Cisco ...
- Recruiting Metrics Excel Template
- PM Dashboards | How to Create Project Dashboard on Mac | How to ...
- Ppm Software Free
- Frequency Distribution Dashboard | 25 Typical Orgcharts | Event ...
- PM Dashboards | Status Dashboard | How to Create Project ...
- How to Create a Sales Dashboard Using ConceptDraw PRO ...
- Performance Indicators | Constant improvement of key performance ...

