KPI Dashboard
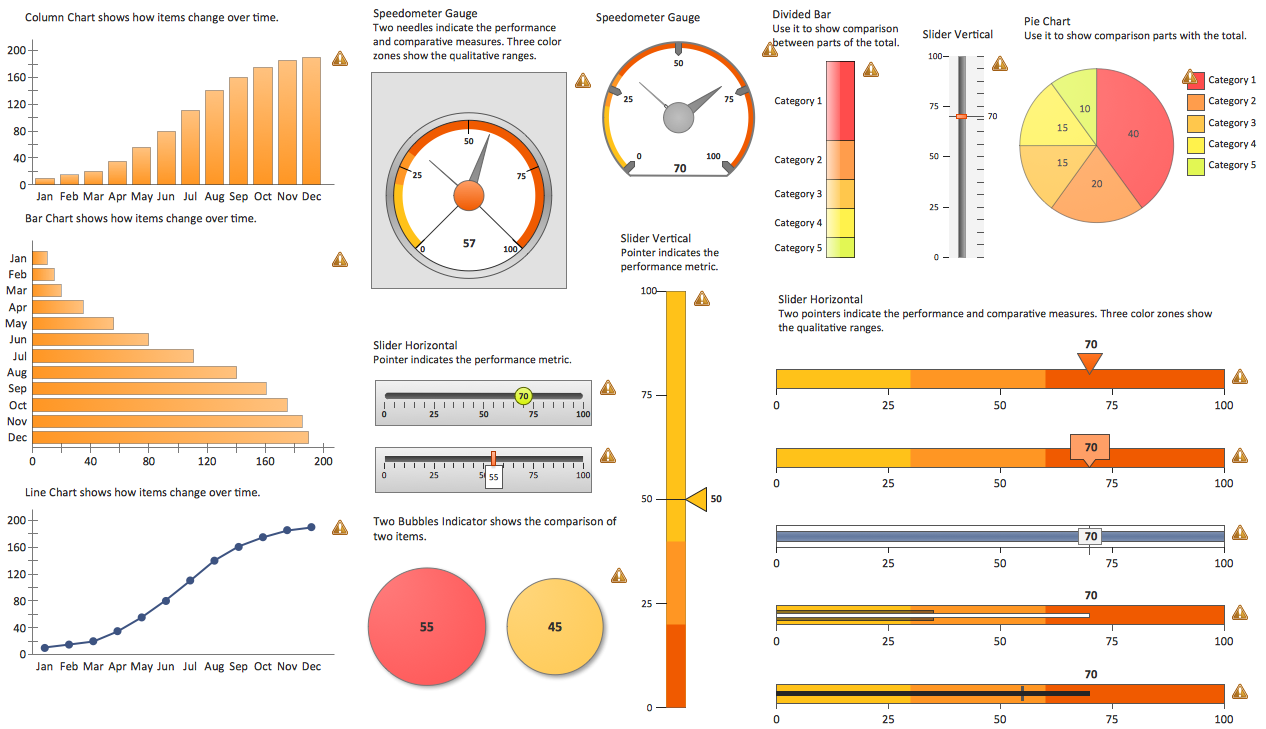
ConceptDraw PRO diagramming and vector drawing software supplied with Sales Dashboard solution from the Marketing area of ConceptDraw Solution Park provides the full set of useful tools which make it the best for producing the live KPI Dashboard of any complexity.
 Sales Dashboard
Sales Dashboard solution extends ConceptDraw PRO software with templates, samples and library of vector stencils for drawing the visual dashboards of sale metrics and key performance indicators (KPI).
Business Graphics Software
ConceptDraw PRO is a business graphics software that allows you improve your business using Sales Performance Dashboard helps you analyze your data more efficiently.HelpDesk
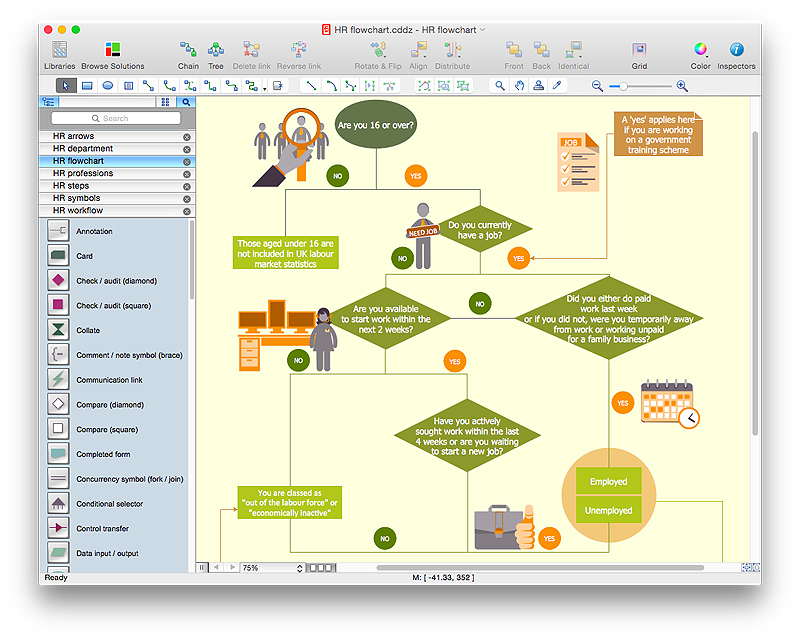
How to Create a HR Process Flowchart Using ConceptDraw PRO
One of the useful tools of each HR specialist is a HR Process Flowchart. HR Flowchart renders step-by-step the process of Human Resource management in any organization. HR flowchart shows the flow of all HR processes, identifies and standardizes the list of mandatory documents required for the implementation of all HR procedures, including the recruiting process. Usually, the descriptions of entire HR processes in a company requires a big set of graphic documents. They must be regularly redrawn to maintain up to date. The best tool for this is ConceptDraw PRO - the best software to create process flow diagrams of various types. In conjunction with ConceptDraw HR flowchart solution, it delivers comprehensive tool-set for human resource management.
 Frequency Distribution Dashboard
Frequency distribution dashboard solution extends ConceptDraw PRO software with samples, templates and vector stencils libraries with histograms and area charts for drawing the visual dashboards showing frequency distribution of data.
Visualize Sales Data Using Sample Data
ConceptDraw PRO software extended with the Sales Dashboard solution allows you visualize sales data using sample data delivered with the solution to choose visual indicators you need, and then connect these indicators to your real data.
 ConceptDraw Dashboard for Facebook
ConceptDraw Dashboard for Facebook solution extends ConceptDraw PRO software with a dynamically updated visual dashboard, which shows lifetime total likes, daily friends of fans, and daily page views, information you can receive from Facebook Insights.
HelpDesk
How to Customize a Task’s Duration
When you create an automatically scheduled task, ConceptDraw PROJECT assigns it duration of one day by default. You need modify that duration to reflect the real amount of time that the task requires.
 PM Dashboards
This solution extends ConceptDraw PRO and ConceptDraw PROJECT software with the ability to clearly display the identified key performance indicators for any project.
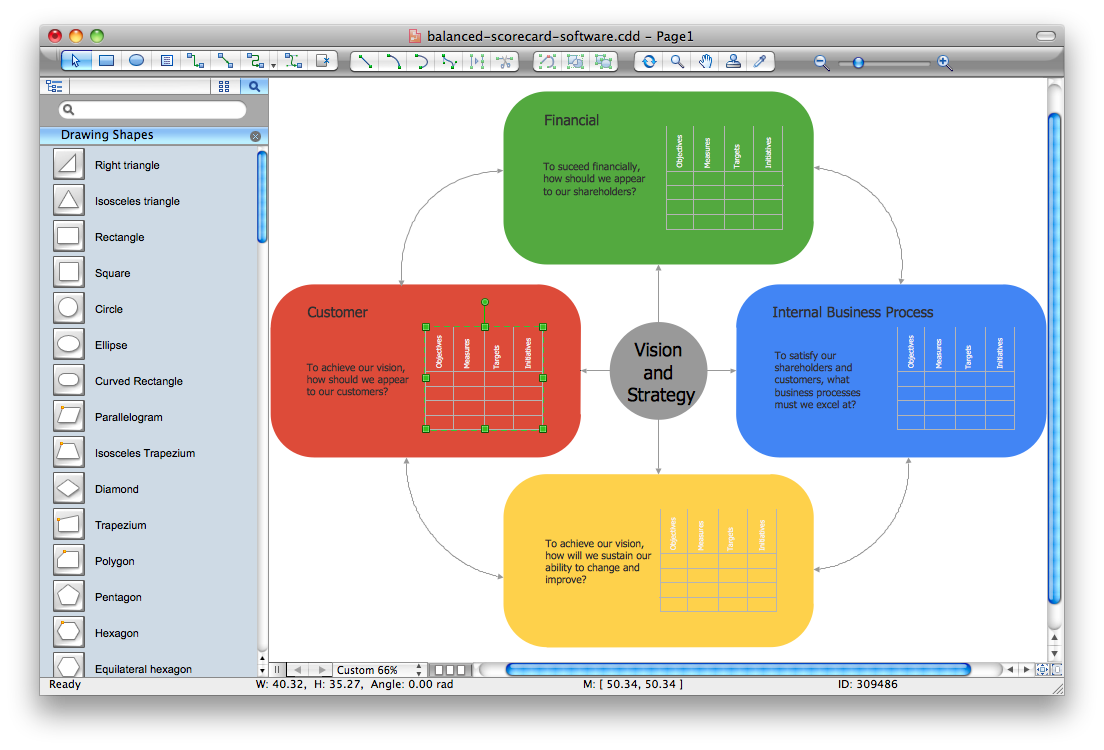
Balanced Scorecard Software
Balanced Scorecard Software provide incredible large variety of samples, templates and libraries of predesigned vector objects. Nothing could be easy that use the predesigned template and fill it, and simply drag the ready-to-use objects for designing your own balanced scorecard diagram.Data Visualization Software Solutions
To see how your business can improve you can try data visualization software solutions that allows you visualize all your sales KPI in one sales dashboard allows you monitor and analyse sales activities.Mind Mapping in the Quality Management
ConceptDraw MINDMAP has a addition to the ConceptDraw Solution Park that provides a creative approach to visualizing quality processes, Quality Mind Map Solution.
 Composition Dashboard
Composition dashboard solution extends ConceptDraw PRO software with templates, samples and vector stencils library with charts and indicators for drawing visual dashboards showing data composition.
 Meter Dashboard
Meter dashboard solution extends ConceptDraw PRO software with templates, samples and vector stencils library with meter indicators for drawing visual dashboards showing quantitative data.
HelpDesk
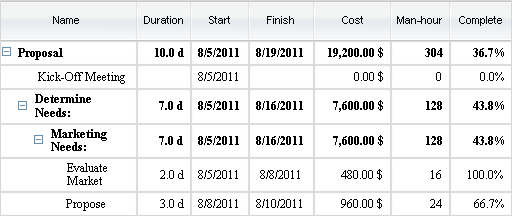
How are Summary Values of Project Phases Calculated
The project schedule usually consists of a list of project tasks joined into project phases. Each task has its own value such as duration, cost, % complete, etc.- Enterprise dashboard | KPI Dashboard | HR Flowcharts | Human ...
- Enterprise dashboard | KPI Dashboard | Business Graphics ...
- KPI Dashboard | Enterprise dashboard | Business Graphics ...
- Enterprise dashboard | KPI Dashboard | Business Intelligence ...
- KPI Dashboard | Enterprise dashboard | Visualize Sales Data Using ...
- KPI Dashboard | Business Graphics Software | Time Series ...
- KPI Dashboard | Business Graphics Software | Data Visualization ...
- KPI Dashboard | Time Series Dashboard | Business Graphics ...
- Human Resource Kpi Dashboard
- KPI Dashboard | Business Intelligence Dashboard | How to Connect ...
- KPI Dashboard | Business Graphics Software | Data Visualization ...
- Enterprise dashboard | Customer Relationship Management ...
- Employee distribution - HR dashboard | How to Create a HR ...
- Kpi Hr
- Employee distribution - HR dashboard | HR dashboard | Frequency ...
- Performance Indicators | What is a KPI ? | KPI Dashboard | Key ...
- Payroll Kpi Dashboard
- KPI Dashboard | A KPI Dashboard Provides the Answers Your Sales ...
- Projects HR dashboard | Competitor Analysis | Venn Diagrams ...
- Hr Dashboard Kpi


