 Entity-Relationship Diagram (ERD)
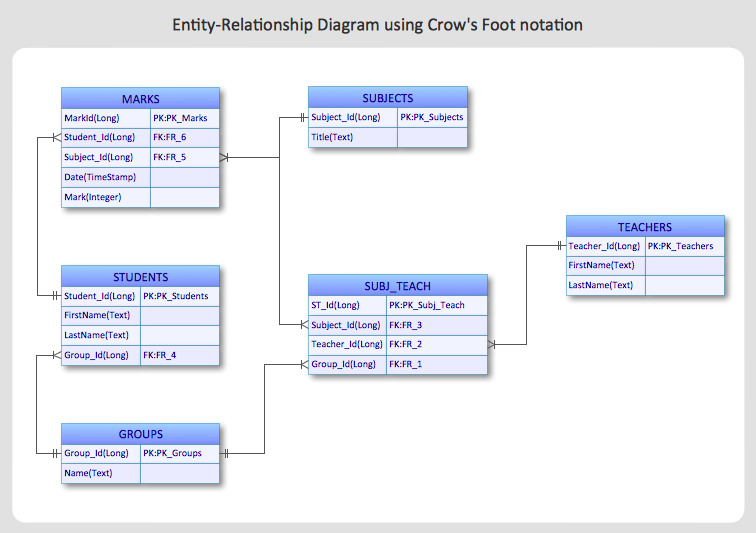
An Entity-Relationship Diagram (ERD) is a visual presentation of entities and relationships. That type of diagrams is often used in the semi-structured or unstructured data in databases and information systems. At first glance ERD is similar to a flowch
 Entity-Relationship Diagram (ERD)
Entity-Relationship Diagram (ERD) solution extends ConceptDraw PRO software with templates, samples and libraries of vector stencils from drawing the ER-diagrams by Chen's and crow’s foot notations.
HelpDesk
How to Create an ERD Diagram
ERD (entity relationship diagram) is used to show the logical structure of databases. It represents the interrelationships between components of database (entities). Entity relationship diagrams are a widely used in software engineering. Using ERD software engineers can control the every aspect of database development. ER diagram can be used as guide for testing and communicating before the release of software product. ERD displays data as entities that are connected with connections that show the relationships between entities. There is some ERD notations used by data bases developers for representing the relationships between the data objects. ConceptDraw PRO and its ERD solution allow you to build ERD diagram of any notation.HelpDesk
How to Create an Entity-Relationship Diagram Using ConceptDraw Solution Park
An entity-relationship diagram (ERD)is used in a database modeling process. ERD diagram shows a graphical representation of objects or concepts within an information system and their relationships.The ability to describe a database using the Entity-Relationship model is delivered by the ConceptDraw ERD solution.
 Interactive Voice Response Diagrams
Interactive Voice Response Diagrams solution extends ConceptDraw PRO v10 software with samples, templates and libraries of ready-to-use vector stencils that help create Interactive Voice Response (IVR) diagrams illustrating in details a work of interactive voice response system, the IVR system’s logical and physical structure, Voice-over-Internet Protocol (VoIP) diagrams, and Action VoIP diagrams with representing voice actions on them, to visualize how the computers interact with callers through voice recognition and dual-tone multi-frequency signaling (DTMF) keypad inputs.
 Metro Map
Metro Map solution extends ConceptDraw PRO software with templates, samples and library of vector stencils for drawing the metro maps, route maps, bus and other transport schemes, or design tube-style infographics.
- Er Diagram For Human Resource Management System
- Human Resources Information System Er Diagram
- ERD Symbols and Meanings | Basic Flowchart Symbols and ...
- ER Diagram Of Human Resource In Simple Way
- Entity-Relationship Diagram ( ERD ) | Block Diagram | Entity ...
- Er Human Resource Management System
- Data Flow Diagram Human Resource Management System
- Total Quality Management Value | HR Management Software | Entity ...
- ConceptDraw PRO Compatibility with MS Visio | Components of ER ...
- Process Flowchart | Fishbone Diagram | Fishbone Diagrams ...
- How To Design Erd For Tour Management System
- Er Diagram For Fishbone Analysis
- Entity-Relationship Diagram ( ERD ) | Data Flow Diagrams ...
- Draw Fishbone Diagram on MAC Software | Entity Relationship ...
- Entity-Relationship Diagram ( ERD ) | Components of ER Diagram ...
- Entity Relationship Diagram Software Engineering | ER Diagram ...
- Crows Foot Er Diagram Library Management System
- Process Flowchart | How to Create Flowcharts for an Accounting ...
- GPS operation diagram | Network Diagram Software (PRO ...

