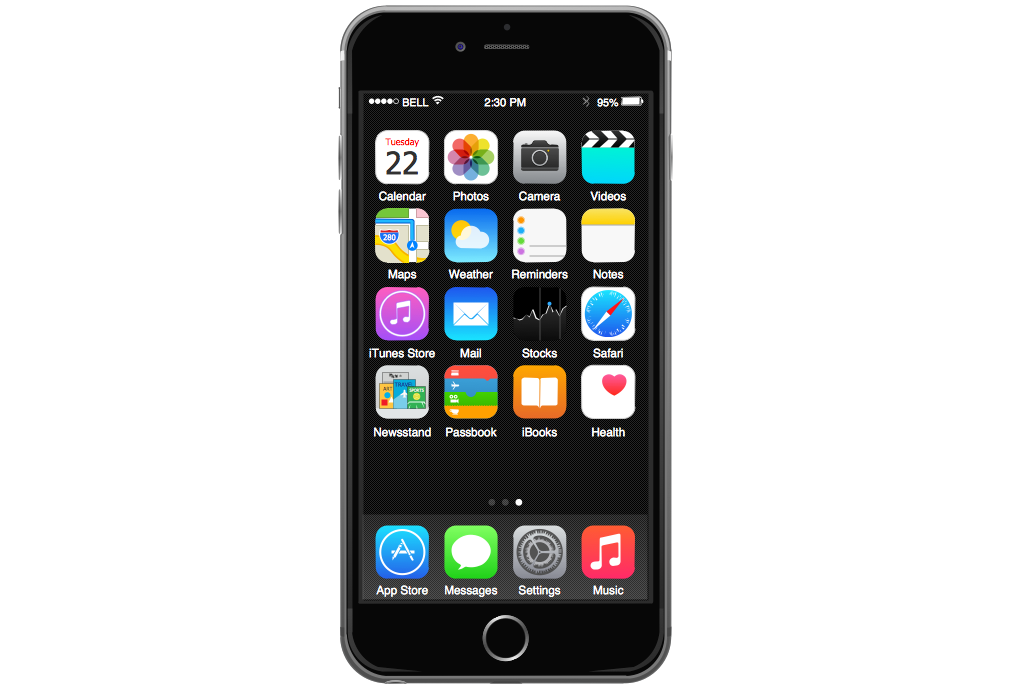
What Is User Interface?
What is user interface (UI)? User interface of any information device includes everything designed you can interact - the screen you are looking, the icons you are clicking. ConceptDraw PRO extended with iPhone User Interface Solution is the best diagramming and vector drawing software for designing clear, pleasant and convenient user interfaces. Convenience is the most important moment for users.How To Draw an iPhone?
How To Draw an iPhone? It's very fast and easy to draw an iPhone and design iPhone user interface using the tools of ConceptDraw PRO extended with iPhone User Interface Solution. iPhone User Interface Solution offers you the incredibly large quantity of predesigned objects that are grouped to 9 libraries: Apps Icons, Bars, Content Views, Controls, iMessage, iPhone 6 Mockup, Tab Bar Icons, Temporary Views, Toolbar and Navigation Bar Buttons.
 Website Wireframe
The innovative Website Wireframe solution enhances the ConceptDraw PRO v10 functionality with newest wireframe tools, libraries with variety of predesigned icons, symbols, buttons, graphics, forms, boxes, and many other vector elements, templates and professionally designed samples, which make it the best wireframing software. Website Wireframe solution gives you significant advantages when designing and maintaining websites, creating skeletal and content-free depictions of website structure, making website prototypes and planning the content arrangement before committing to design, also speeds up the processes of sketching, producing and sharing wireframe examples of website style and interface design.
Stakeholder Onion Diagram Template
For depicting the onion model are actively used Stakeholder Onion Diagrams. The ConceptDraw PRO diagramming and vector drawing software extended with Stakeholder Onion Diagrams Solution from the Management Area of ConceptDraw Solution Park offers the number of useful tools and Stakeholder Onion Diagram template for their easy design.Circles Venn Diagram
This example shows the 4 Circle Venn Diagram. The Venn Diagram visualizes all possible logical relations between several sets. The sets are represented as circles on the Venn Diagram. On this example you can see the intersections of 4 sets. Venn Diagrams are widely used in mathematics, logic, statistics, marketing, sociology, etc.Deployment Chart Software
ConceptDraw PRO extended with Matrices solution from the Marketing area of ConceptDraw Solution Park is the best Deployment Chart Software. The Matrices solution offers you the useful tools for creating Deployment Charts in just minutes. The Deployment Charts designed with ConceptDraw PRO are vector graphic documents and are available for reviewing, modifying, converting to a variety of formats (image, HTML, PDF file, MS PowerPoint Presentation, Adobe Flash or MS Visio XML), printing and send via e-mail in one moment.Venn Diagram Maker
ConceptDraw PRO diagramming and vector drawing software extended with Venn Diagrams solution from the "Diagrams" area of ConceptDraw Solution Park is a powerful Venn Diagram maker. Create fast and easy your own Venn Diagrams to visualize: all the possible logical relations between sets, simple set relationships in logic, statistics, mathematics, sociology, marketing, summarize the status and future viability of a project.Basketball Plays Software
Basketball is a popular sport played by two teams of five players with a ball. The game takes place on a rectangular court. The team goal is to score a ball into the basket of the opponent team. The team with the most points wins the game. ConceptDraw PRO diagramming and vector drawing software extended with Basketball solution from the Sport area of ConceptDraw Solution Park is a very useful tool for designing the basketball-related diagrams of any complexity.2 Circle Venn Diagram. Venn Diagram Example
Using the ready-to-use predesigned objects, samples and templates from the Venn Diagrams Solution for ConceptDraw PRO you can create your own professional looking Venn Diagrams quick and easy.Venn Diagram
Venn diagrams are illustrations used in the branch of mathematics known as set theory. They show the mathematical or logical relationship between different groups of things (sets). A Venn diagram shows all the possible logical relations between the sets.- How to Design a Mockup of Apple macOS Sierra GUI | iPhone User ...
- How to Design a Mockup of Apple macOS Sierra GUI | Mac OS X ...
- How to Design a Mockup of Windows 10 User Interface | How to ...
- Mac OS User Interface Design Examples | How to Design a Mockup ...
- Wireframe GUI - Template | Wireframe - Vector stencils library ...
- How to Design an Interface Mock-up of an Android Application | GUI ...
- App Application
- How to Design a Mockup of Windows 10 User Interface | Window ...
- Design elements - Windows 8 UI | Design elements - Android UI ...
- Top 5 Android Flow Chart Apps | Design elements - Yosemite Apps ...


