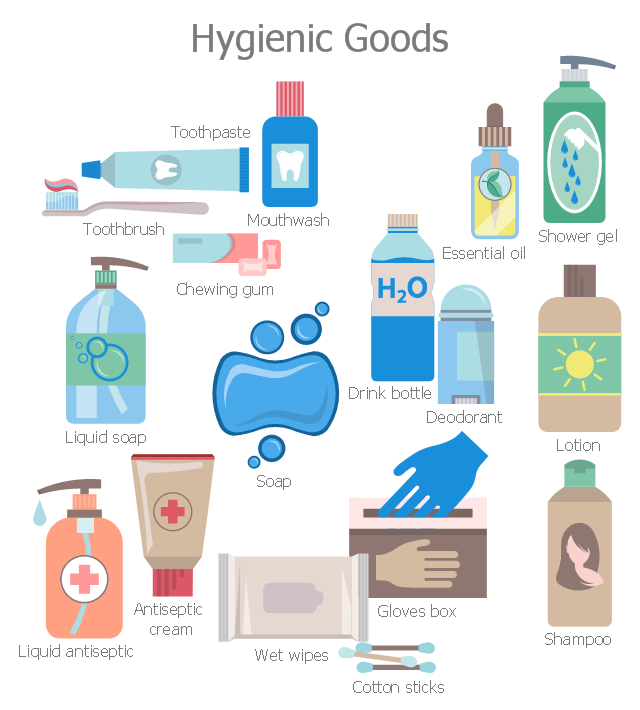
This infographic sample shows hygienic products.
"Hygiene is a set of practices performed for the preservation of health. According to the World Health Organization (WHO), "Hygiene refers to conditions and practices that help to maintain health and prevent the spread of diseases."
Whereas in popular culture and parlance it can often mean mere 'cleanliness', hygiene goes much beyond that to include all circumstances and practices, lifestyle issues, premises and commodities that engender a safe and healthy environment, especially in modern medicine." [Hygiene. Wikipedia]
The healthcare products infographic example "Hygienic goods" was designed using ConceptDraw PRO software extended with Pharmacy Illustrations solution from Health area of ConceptDraw Solution Park.
Infographic example
Used Solutions
Health
>
 Pharmacy Illustrations
Pharmacy Illustrations solution with improbable quantity of predesigned vector objects and icons of pharmacy symbols, medical and health products, pharmacy images of drugstore products, pharmacy clipart of medication tools, pharmacy logo, and other pharmacy pictures is the best for designing the pharmacy illustrations of varied kinds, pharmacy and medical diagrams and schematics, for making the presentation slides and posters on the medical, pharmacy, pharmacology and pharmaceutical thematics, for designing the illustrative materials about ways of prevention diseases and also treatment them, for creation colorful illustrations helpful in newborn and baby care, the infographics and collages to be presented at the premises of medical establishments and during the lectures at the medical education institutions, also on the billboards and in other advertising materials.
Fishbone Diagram Problem Solving
