 SWOT Analysis
SWOT and TOWS Matrix Diagrams solution extends ConceptDraw DIAGRAM and ConceptDraw MINDMAP software with features, templates, samples and libraries of vector stencils for drawing SWOT and TOWS analysis matrices and mind maps.
How to Make SWOT Analysis in a Word Document
A SWOT Analysis is a popular tool of the strategic planning which is used to evaluate the Strengths, Weaknesses, Opportunities, and Threats that are involved in any businesses. Use of mind maps allows you to collect a lot of information used for SWOT Analysis, visually structure it and also identify the relationships between different parts of this information. SWOT and TOWS Matrix Diagrams solution for ConceptDraw Solution Park combines professional visual advantages of ConceptDraw MINDMAP software and presentation capabilities of ConceptDraw DIAGRAM , which together provide a complete work solution. The SWOT and TOWS diagrams, matrices or mind maps produced in ConceptDraw DIAGRAM using the predesigned vector objects or filling the ready templates, can be then easily exported to Microsoft Word, Microsoft Visio, Microsoft PowerPoint, Adobe PDF, and many other electronic file formats. The possibility of export makes easy the use of SWOT diagrams designed in ConceptDraw DIAGRAM and lets you efficiently collaborate even with people who maybe don't have this software.
 Marketing
This solution extends ConceptDraw DIAGRAM and ConceptDraw MINDMAP with Marketing Diagrams and Mind Maps (brainstorming, preparing and holding meetings and presentations, sales calls).
 Management
This solution extends ConceptDraw DIAGRAM and ConceptDraw MINDMAP with Management Diagrams and Mind Maps (decision making, scheduling, thinking ideas, problem solving, business planning, company organizing, SWOT analysis, preparing and holding meetings
 Business Productivity Area
Business Productivity Solutions extend ConceptDraw products with tools for making presentations, conducting meetings, preparing documents, brainstorming, or building new strategies.
 ConceptDraw Solution Park
ConceptDraw Solution Park collects graphic extensions, examples and learning materials
 ConceptDraw Solution Park
ConceptDraw Solution Park collects graphic extensions, examples and learning materials
HelpDesk
How to Create a HR Process Flowchart
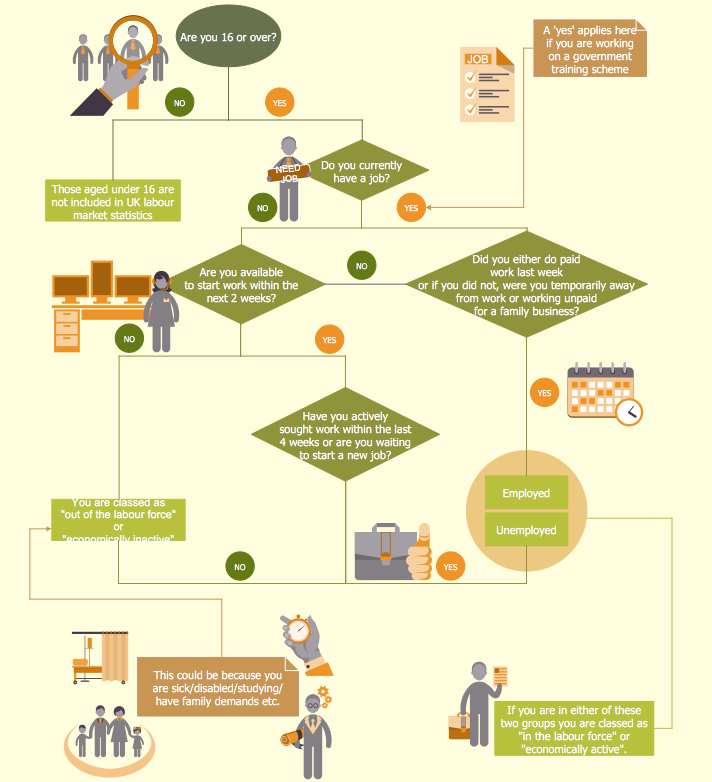
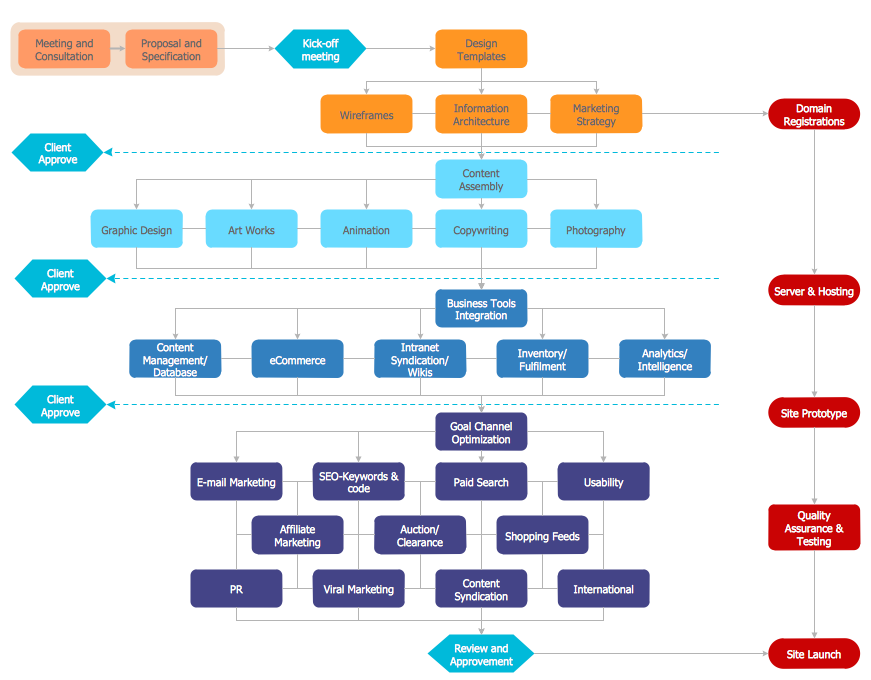
One of the useful tools of each HR specialist is a HR Process Flowchart. HR Flowchart renders step-by-step the process of Human Resource management in any organization. HR flowchart shows the flow of all HR processes, identifies and standardizes the list of mandatory documents required for the implementation of all HR procedures, including the recruiting process. Usually, the descriptions of entire HR processes in a company requires a big set of graphic documents. They must be regularly redrawn to maintain up to date. The best tool for this is ConceptDraw DIAGRAM - the best software to create process flow diagrams of various types. In conjunction with ConceptDraw HR flowchart solution, it delivers comprehensive tool-set for human resource management.HelpDesk
How to Resize Objects
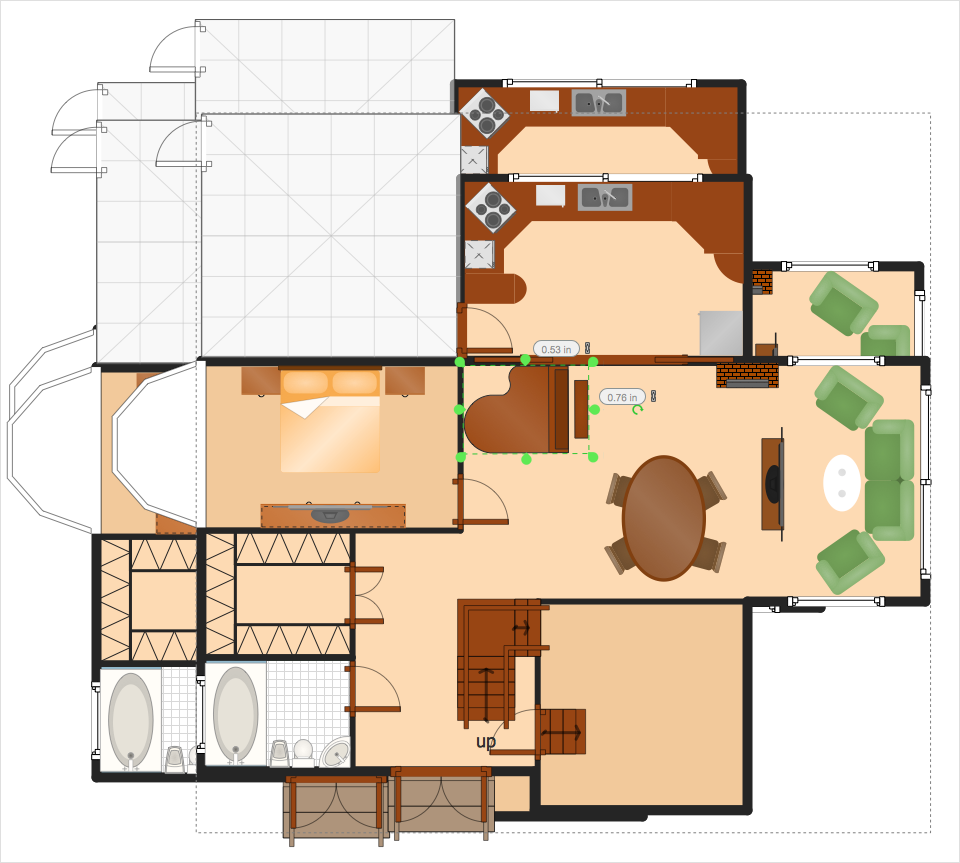
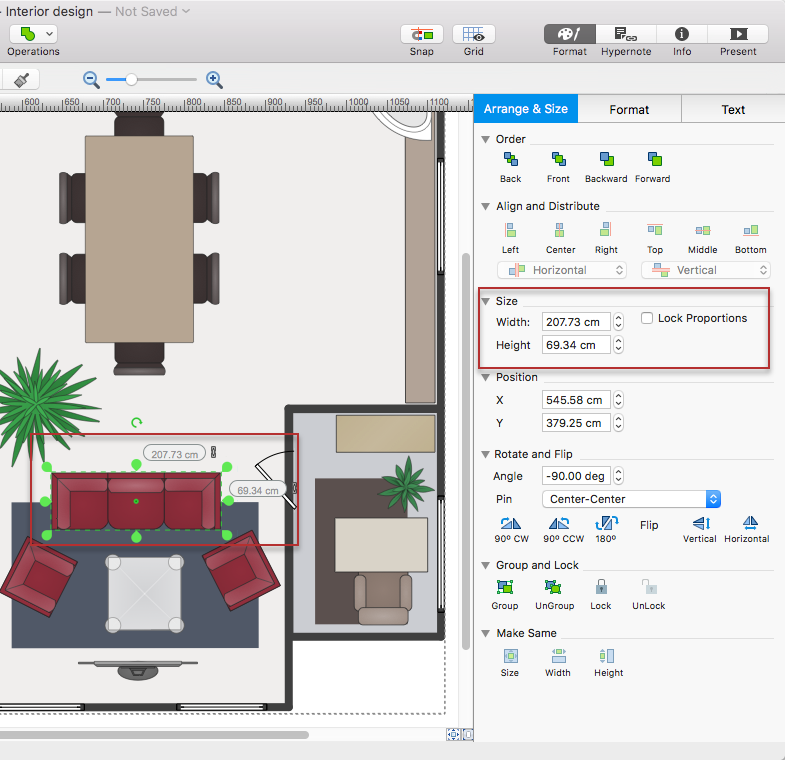
When creating diagram using ConceptDraw DIAGRAM , you can select, move, resize and rotate objects. After selecting an object (or objects) in a document, you can change it position, resize it or move an object to the desired position. The sizes of objects in ConceptDraw DIAGRAM can be changed by simple dragging, or you can set a particular size of any object. Using ConceptDraw PRO, you can re-size an object on the page using the absolute measurements instead of a mouse. You can make quick work of designing complex drawing using a combination of different-sized items.HelpDesk
How to Add a Self-Drawn Object to a Library
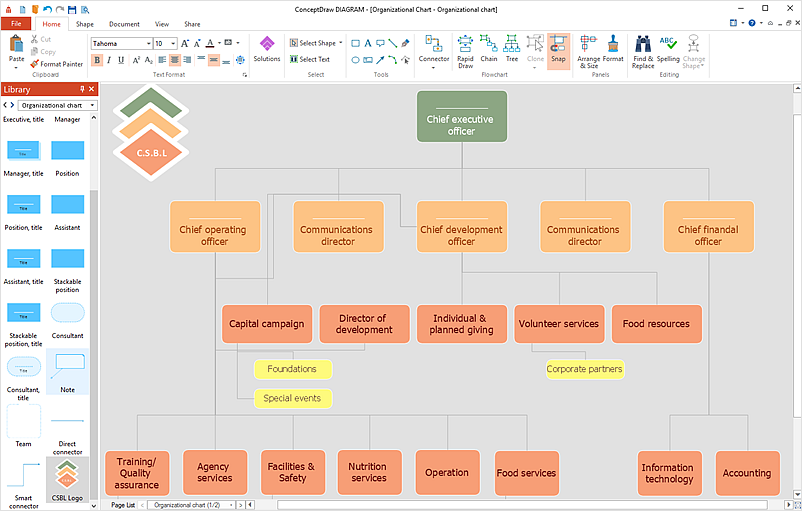
One of the key elements of ConceptDraw DIAGRAM solutions are the libraries, containing a set of associated objects. Using these collections of business oriented vector objects, you can quickly get started making the diagram in the theme you need. The library collection can be supplemented by creating new or editing existing objects. You can create your own unique library just by dragging objects with the mouse. Library objects can be customized and saved for later use. You can change the scaling, color, line weight, label, and even the fill pattern of an object to use in custom drawings and diagrams. Your custom objects even can be searched for the next time you need to use them.HelpDesk
How to Connect Objects on PC
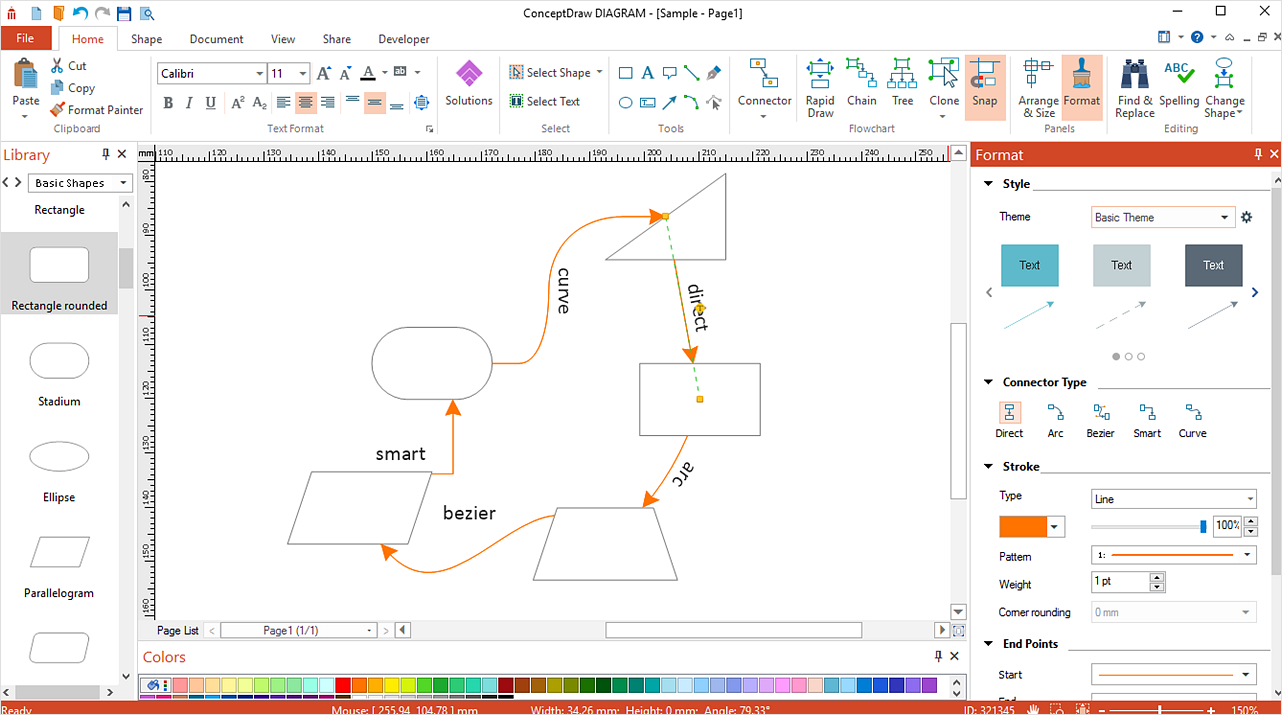
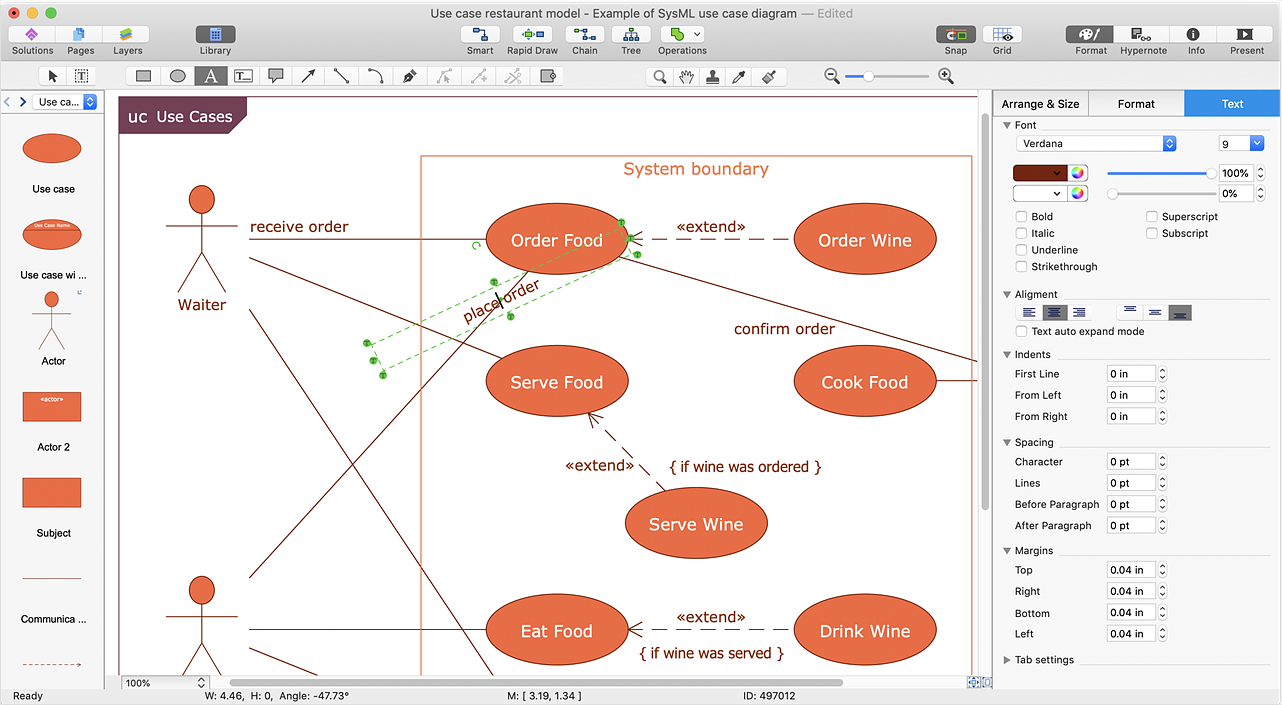
ConceptDraw DIAGRAM provides a few options for drawing connections between objects: Direct Connectors, Smart, Arc, Bezier, Curve and Round Connectors. You can connect objects in your ConceptDraw diagram with proper connectors using the embedded automatic connection modes. This article describes how you can connect objects with connectors and how you can ascribe different types and behaviors.HelpDesk
How to Edit Grouped Objects on PC
ConceptDraw DIAGRAM allows one to group objects. Grouping shapes, pictures, or objects lets you style, format, rotate, and move them together, as though they were a single object. At the same time, you can edit each of them separately.HelpDesk
How to Work with Custom Properties
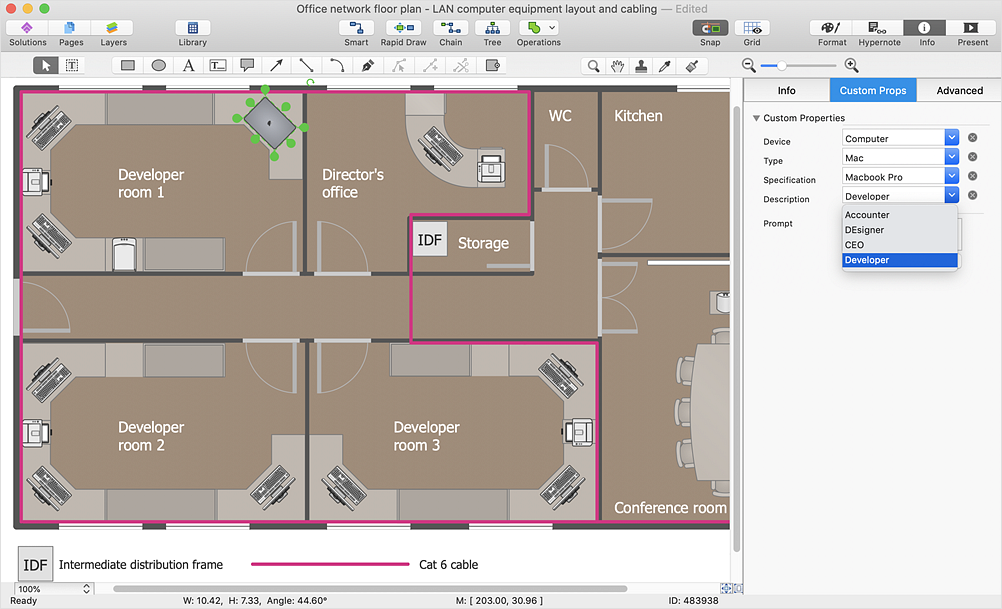
ConceptDraw DIAGRAM can store additional, user-defined data that can be assigned to a particular shape. This data is stored in the Custom Properties options.HelpDesk
How to Make a Rapid Draw Object
The Rapid Draw technology is an automatic drawing system. It is designed to significantly reduce the time of creating flowcharts and diagrams. Especially those, consisting from some typical entities. You can extend the standard ConceptDraw DIAGRAM object libraries with new objects by customizing any item from any library and assigning it with Rapid Draw features. You can quickly create and edit complex drawings using Rapid Draw technology and your self-created objects.HelpDesk
How to Change the Measurement Units and Drawing Scale
ConceptDraw DIAGRAM allows you to work with drawings with many different measurement units.HelpDesk
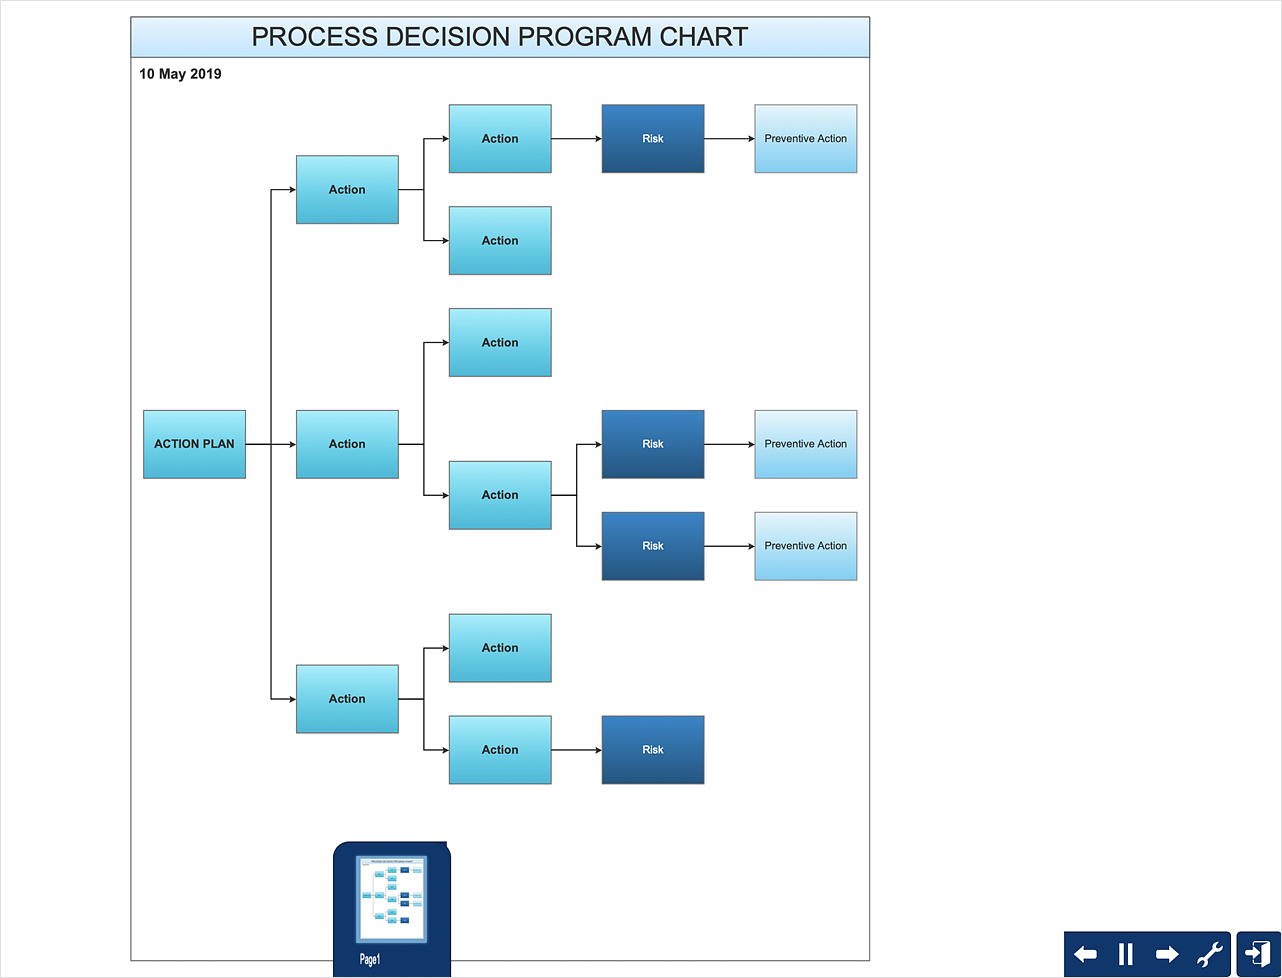
How To Create Risk Diagram (PDPC) Using Solutions
Risk diagram is used to identify possible risks in accomplishing corrective actions. With the Risks diagram, one analyzes each action separately in a tree of all actions and develops a preventive action in response to each potential obstacles or circumstances which may be a risk. The ability to create a Risk diagram from a mind map is supported by the ConceptDraw Seven Management and Planning Tools solution. This article describes how to identify possible risks when carrying out corrective actions, and define preventive actions.HelpDesk
How to Add and Edit Connector Text
The new ConceptDraw Arrows10 Technology is a powerful diagramming technique that powered the way business drawing created. ConceptDraw DIAGRAM gives you some tools for connecting shapes: Direct Connectors, Smart, Arc, Bezier, Curve and Round Connectors.Direct Connectors are direct lines from the point to the point. Smart , Arc, Bezier, Curve and Round Connectors are almost the same as Direct Connectors. However, they automatically move around other objects. You can use Chain, or Tree connection mode for connection of multiple objects with any type of connectors. ConceptDraw DIAGRAM allows you to add and move text on a connector the same way that you add and move text on other any object.HelpDesk
How to Create a New Library
Sometimes, when creating a diagram, you need to use a large set of elements from different libraries. If you are using ConceptDraw , in such case, we recommend you to create a new library, which consists of vector library objects from other ConceptDraw libraries. You also can add some custom unique objects into such library. Each object that contains in a new library can be provided with a unique description and keyword list. Thus, the new library and its objects will be indexed to be searched and used in the further diagrams.HelpDesk
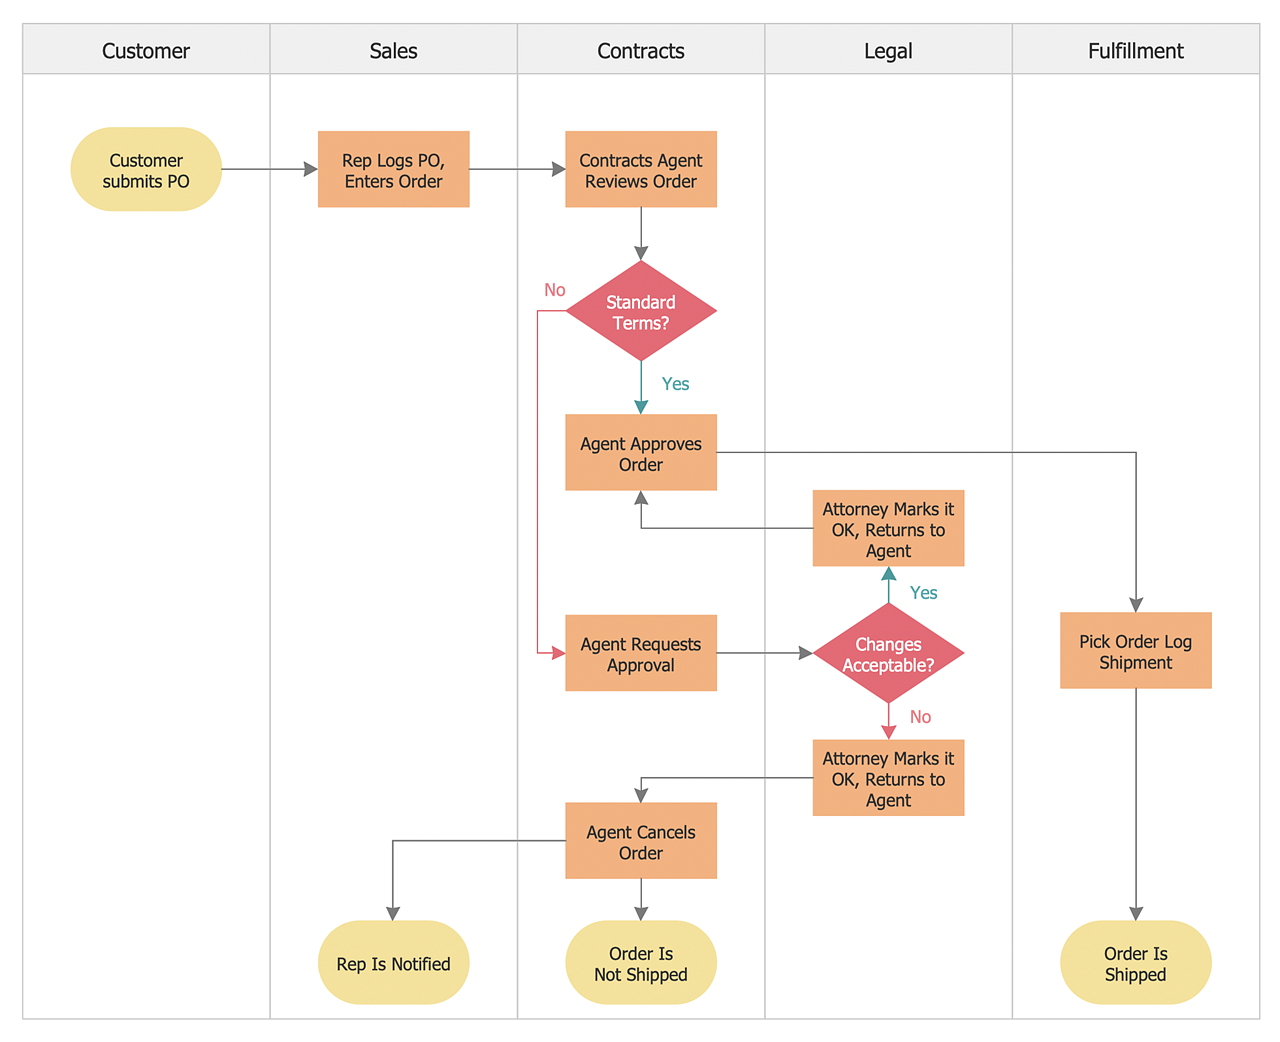
How to Create a Cross-Functional Flowchart
Cross-functional flowcharts are used to visualize cross-functional processes. A cross-functional process is a process that involves multiple divisions, each of which makes its part of the entire company workflow. For example product development, lead management, client orders processing – and other critical processes. All of them are important both for business and customers, but the workflow and responsibilities distribution within these processes are divided between multiple departments and services. Cross-functional processes cannot be depicted with simple workflow diagrams, because of the specific interactions between company departments. ConceptDraw DIAGRAM has released a specialized solution to create cross-functional diagrams. Cross-Functional Flowcharts solution includes a special set of templates and libraries to depict the cross-functional processes.- SWOT analysis Software & Template for Macintosh and Windows
- SWOT Matrix Template
- New business opportunity SWOT analysis matrix - Template portrait ...
- SWOT Analysis Solution - Strategy Tools | Mind Maps for Business ...
- How to Create a PowerPoint Presentation from a SWOT Analysis ...
- SWOT Analysis Solution - Strategy Tools | TOWS analysis matrix ...
- SWOT Analysis Solution - Strategy Tools | SWOT and TOWS Matrix ...
- SWOT analysis matrix
- Feature Comparison Chart Software | SWOT analysis matrix ...
- How to Make SWOT Analysis in a Word Document | SWOT Analysis ...
- SWOT matrix template | Ansoff Product-Market Growth Matrix ...
- How to Make SWOT Analysis in a Word Document | Word Exchange ...
- Porter's value chain diagram template | Design elements - Matrices ...
- Ansoff's product / market matrix | How to Make an Ansoff Matrix ...
- Four-quadrant matrix template | Seven Management and Planning ...
- Diagram Creator | Software Diagram & UML Diagram Tool | Cubetto ...
- Marketing | Feature Comparison Chart Software | SWOT analysis ...
- IVR diagram multipage sample | How to Create a PowerPoint ...
- iPhone OS (iOS) graphic user interface (GUI) - Template | iPhone ...
- How to Create a PowerPoint® Presentation from a Mind Map | How ...

