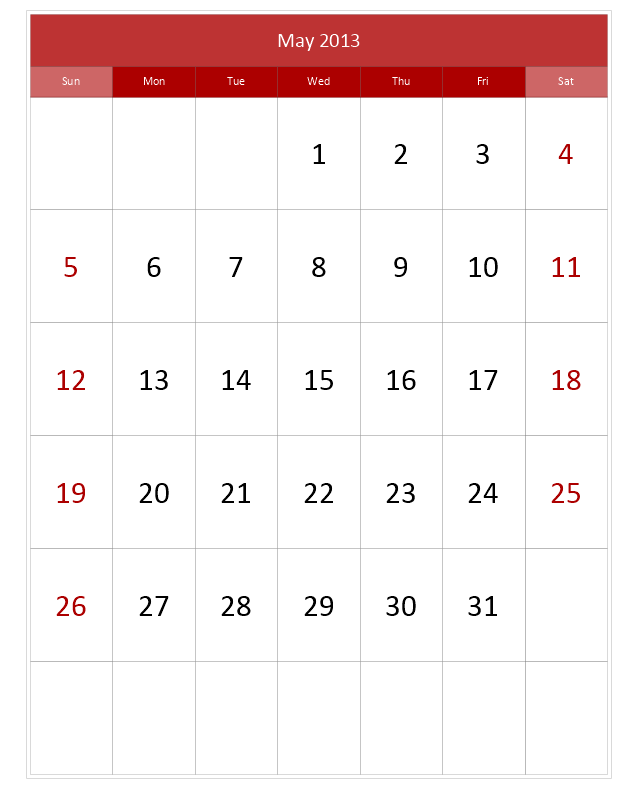
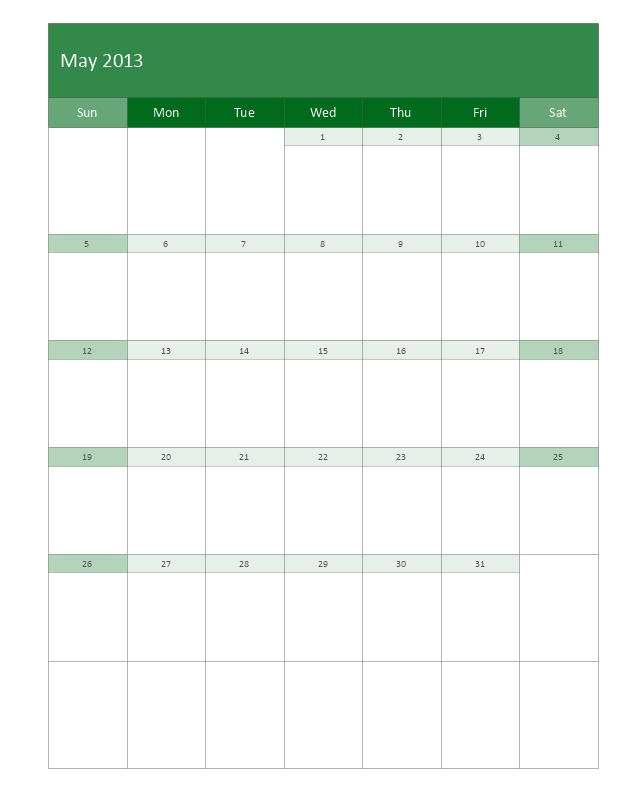
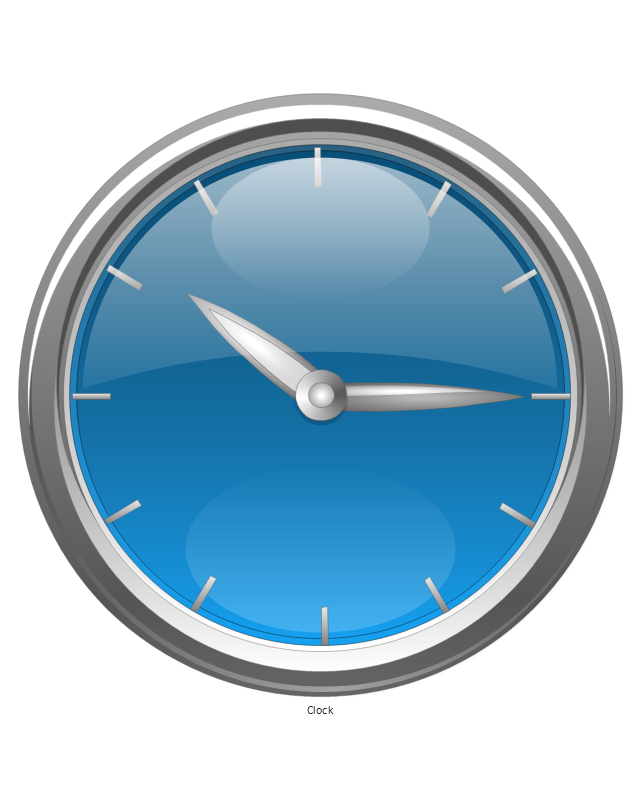
The vector stencils library "Calendars" contains 44 shapes of month calendars, marker icons and symbols for schedules, and clocks. Use it to create your calendars in the ConceptDraw PRO diagramming and vector drawing software extended with the Calendars solution from the Management area of ConceptDraw Solution Park.
Process Flowchart
The main reason of using Process Flowchart or PFD is to show relations between major parts of the system. Process Flowcharts are used in process engineering and chemical industry where there is a requirement of depicting relationships between major components only and not include minor parts. Process Flowcharts for single unit or multiple units differ in their structure and implementation. ConceptDraw PRO is Professional business process mapping software for making Process flowcharts, Process flow diagram, Workflow diagram, flowcharts and technical illustrations for business documents and also comprehensive visio for mac application. Easier define and document basic work and data flows, financial, production and quality management processes to increase efficiency of your business with ConcepDraw PRO. Business process mapping software with Flowchart Maker ConceptDraw PRO includes extensive drawing tools, rich examples and templates, process flowchart symbols and shape libraries, smart connectors that allow you create the flowcharts of complex processes, process flow diagrams, procedures and information exchange. Process Flowchart Solution is project management workflow tools which is part ConceptDraw Project marketing project management software. Drawing charts, diagrams, and network layouts has long been the monopoly of Microsoft Visio, making Mac users to struggle when needing such visio alternative like visio for mac, it requires only to view features, make a minor edit to, or print a diagram or chart. Thankfully to MS Visio alternative like ConceptDraw PRO software, this is cross-platform charting and business process management tool, now visio alternative for making sort of visio diagram is not a problem anymore however many people still name it business process visio tools.
The vector stencils library "Time and clock pictograms" contains 20 time pictograms: clocks, calendars, day, week, bell, alarm clock, hourglass, wristwatch, and time intervals symbols.
Use it to create temporal infographic, illustrations and diagrams.
The example "Time and clock pictograms - Vector stencils library" was created using the ConceptDraw PRO diagramming and vector drawing software extended with the Pictorial infographics solution from the area "What is infographics" in ConceptDraw Solution Park.
Value Stream Mapping Symbols
VSM symbols are the best for a production process designing. The entire Value Stream Mapping method uses a graphical representation of the manufacturing process, factors' pros and cons, that all stakeholders can easily understand. Value Stream Mapping is a graphical technique that provides possibilities to improve analysis of a manufacturing process, at the stage of the transferring information or materials that required to deliver a product or service to the customer.
 Bar Graphs
The Bar Graphs solution enhances ConceptDraw PRO v10 functionality with templates, numerous professional-looking samples, and a library of vector stencils for drawing different types of Bar Graphs, such as Simple Bar Graph, Double Bar Graph, Divided Bar Graph, Horizontal Bar Graph, Vertical Bar Graph, and Column Bar Chart.
 Health Food
The Health Food solution contains the set of professionally designed samples and large collection of vector graphic libraries of healthy foods symbols of fruits, vegetables, herbs, nuts, beans, seafood, meat, dairy foods, drinks, which give powerful possi
Business Process Workflow Diagram
Business Process Workflow Diagram is a professional visual tool that is widely applied for business development, business analysis, business process optimization and documenting business processes. Business Process Workflow Diagram lets depict in details the steps of business processes and flow of tasks between them, the execution of business processes, transfer of data and documents. The workflows on the Business Process Workflow Diagram are represented using the set of common symbols which let easy illustrate business processes and process flows, depict the start, all major steps and end of the process, what data are used by the process, how the data flow through the business areas within scope of our project, how the tasks are executed and by who, and how workers interact with each other.
 Business Process Diagrams
Business Process Diagrams solution extends the ConceptDraw PRO BPM software with RapidDraw interface, templates, samples and numerous libraries based on the BPMN 1.2 and BPMN 2.0 standards, which give you the possibility to visualize equally easy simple and complex processes, to design business models, to quickly develop and document in details any business processes on the stages of project’s planning and implementation.
Cross-Functional Flowchart (Swim Lanes)
Cross-Functional Flowchart is a type of chart which shows the series of process steps connected by the arrows to depict their order and applies the swim lanes to provide an extra dimension with means of assigning each process step to certain category. Often the category or the functional unit is a stakeholder (department, person, role), resource, project, phase, or any other attribute. Cross-Functional Flowcharts visually illustrate relationships between the business processes and the functional units responsible for this processes. ConceptDraw PRO is a powerful diagramming and vector drawing software for professional design Cross-Functional Flowcharts using the common notation of shapes and swim lanes. Cross-Functional Flowcharts solution included to the Business Processes area of ConceptDraw Solution Park provides numerous well-designed vector objects and connector tools for quick, easy and effective organizing information, representing process flows and relationships, and drawing Cross-Functional Flowcharts for business, science, education, technology, etc.- 7 Days Icon
- Computer Network Diagrams | White 7 Edges Star Png
- App icons - Vector stencils library | iPhone User Interface | iPhone ...
- Calendars - Vector stencils library | Arrow Icon Png 32x32
- Number 7 Stencil
- Calendars - Vector stencils library | Windows 8 apps - Vector stencils ...
- Design elements - Apps icons | App icons - Vector stencils library ...
- Network Icon | Time and clock pictograms - Vector stencils library ...
- App icons - Vector stencils library | Design elements - Apps icons ...
- Time 24 Hrs Icon
-calendars---vector-stencils-library.png--diagram-flowchart-example.png)
-calendars---vector-stencils-library.png--diagram-flowchart-example.png)
-calendars---vector-stencils-library.png--diagram-flowchart-example.png)
-calendars---vector-stencils-library.png--diagram-flowchart-example.png)
-calendars---vector-stencils-library.png--diagram-flowchart-example.png)
-calendars---vector-stencils-library.png--diagram-flowchart-example.png)
-calendars---vector-stencils-library.png--diagram-flowchart-example.png)
-calendars---vector-stencils-library.png--diagram-flowchart-example.png)
-calendars---vector-stencils-library.png--diagram-flowchart-example.png)
-calendars---vector-stencils-library.png--diagram-flowchart-example.png)
-calendars---vector-stencils-library.png--diagram-flowchart-example.png)


-calendars---vector-stencils-library.png--diagram-flowchart-example.png)



-calendars---vector-stencils-library.png--diagram-flowchart-example.png)
-calendars---vector-stencils-library.png--diagram-flowchart-example.png)
-calendars---vector-stencils-library.png--diagram-flowchart-example.png)
-calendars---vector-stencils-library.png--diagram-flowchart-example.png)
-calendars---vector-stencils-library.png--diagram-flowchart-example.png)
-calendars---vector-stencils-library.png--diagram-flowchart-example.png)
-calendars---vector-stencils-library.png--diagram-flowchart-example.png)
-calendars---vector-stencils-library.png--diagram-flowchart-example.png)
-calendars---vector-stencils-library.png--diagram-flowchart-example.png)
-calendars---vector-stencils-library.png--diagram-flowchart-example.png)
-calendars---vector-stencils-library.png--diagram-flowchart-example.png)

