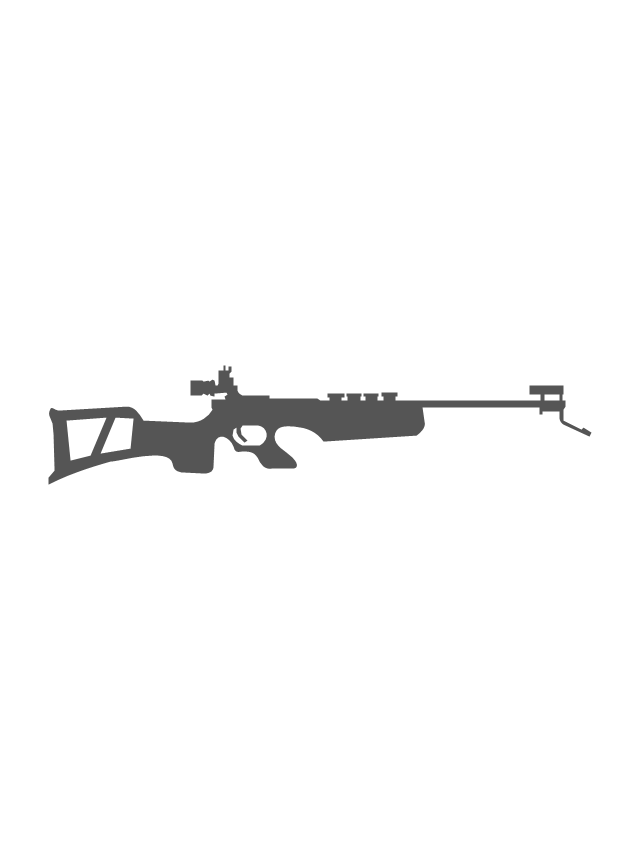
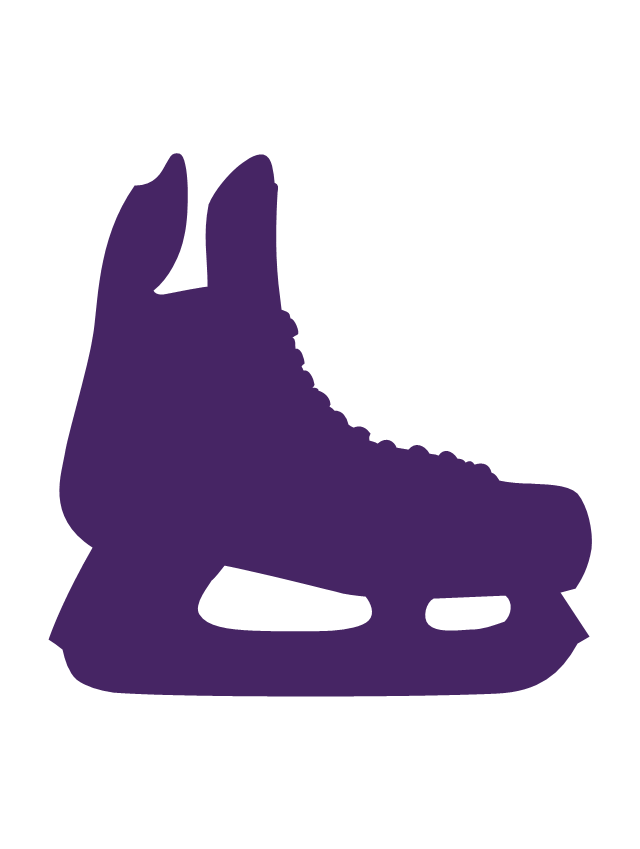
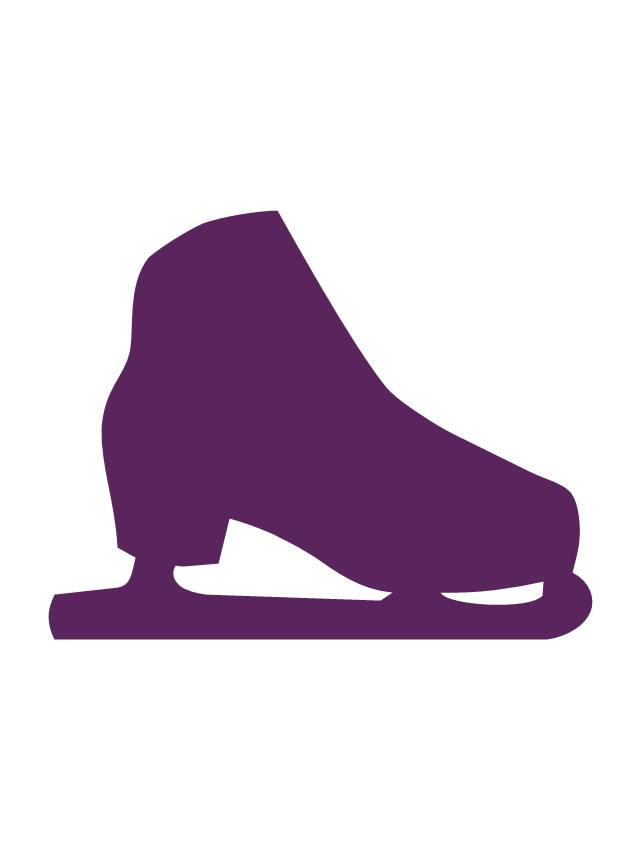
The vector stencils library "Winter Olympics pictograms" contains 29 pictograms and silhouettes.
Use it for drawing Winter Olympics diagrams, infographics and illustrations in the ConceptDraw PRO diagramming and vector drawing software extended with the Winter Sports solution from the Sport area of ConceptDraw Solution Park.
Use it for drawing Winter Olympics diagrams, infographics and illustrations in the ConceptDraw PRO diagramming and vector drawing software extended with the Winter Sports solution from the Sport area of ConceptDraw Solution Park.
"A 'Luge' ... is a small one- or two-person sled on which one sleds supine (face up) and feet-first. Steering is done by flexing the sled's runners with the calf of each leg or exerting opposite shoulder pressure to the seat. ... Luge is also the name of an Olympic sport. Of the three Olympic sliding sports, which include bobsleigh and skeleton, luge is the fastest and most dangerous. Lugers can reach speeds of 140 km per hour (87 mph). ...
Street luge is a recent innovation of the sport. It is considered an extreme sport, as well as an Olympic sport.
Lugers compete against a timer and are timed to a thousandth of a second, making luge one of the most precisely timed sports in the world." [Luge. Wikipedia]
The vector icon example "Luge" represents one of 20 symbols from the Winter sports pictograms library for the ConceptDraw PRO diagramming and vector drawing software.
The design elements library Winter sports pictograms is included in the Winter Sports solution from the Sport area of ConceptDraw Solution Park.
Winter Sports Vector Clipart. Medal Map. Spatial Infographics
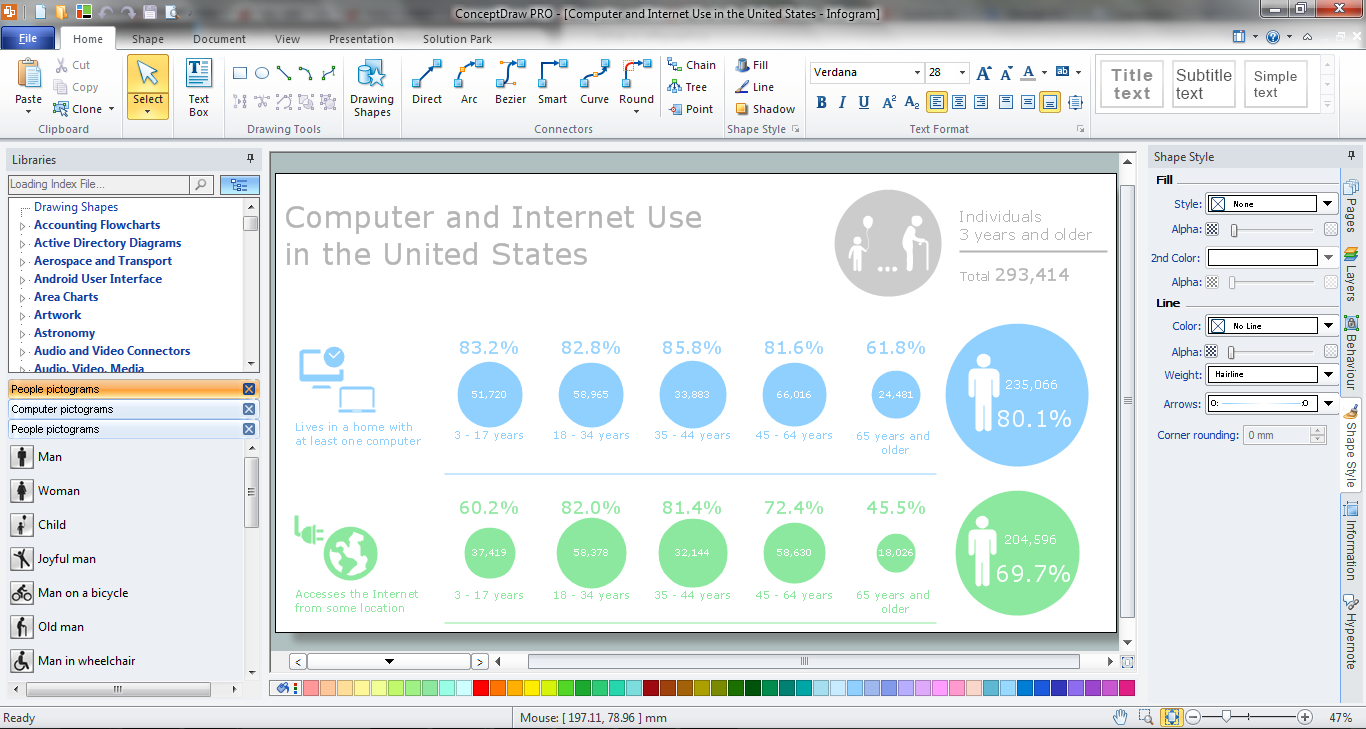
Tracking Olympic results in visual format is the most modern way to deliver statistics to a broad audience. This is a good example of an illustrated table you may easily modify, print, or publish on web from ConceptDraw Winter Sports solution ."Speed skating, or speedskating, is a competitive form of ice skating in which the competitors race each other in traveling a certain distance on skates. Types of speed skating are long track speed skating, short track speed skating, and marathon speed skating. In the Olympic Games, long-track speed skating is usually referred to as just "speed skating", while short-track speed skating is known as "short track". The ISU, the governing body of both ice sports, refers to long track as "speed skating" and short track as "short track skating". ...
The sport originates from pack-style events held in North America and was officially sanctioned in the 1970s, becoming an Olympic sport in 1992. Although this form of speed skating is newer, it is growing faster than long-track speed skating, largely because short track can be done on an ice hockey rink rather than a long-track oval." [Speed skating. Wikipedia]
The vector icon example "Speed skating" represents one of 20 symbols from the Winter sports pictograms library for the ConceptDraw PRO diagramming and vector drawing software.
The design elements library Winter sports pictograms is included in the Winter Sports solution from the Sport area of ConceptDraw Solution Park.
Winter Sports. Using Winter Sports Design Elements Producing Infographics
The Winter Sports solution from Sport Area of ConceptDraw Solution Park contains winter sports pictogram you may use illustrating any kind of material about Olympic Games or any other sport competitions.
 Winter Sports
The Winter Sports solution from Sport area of ConceptDraw Solution Park contains winter sports illustration examples, templates and vector clipart libraries.
Infographic Software
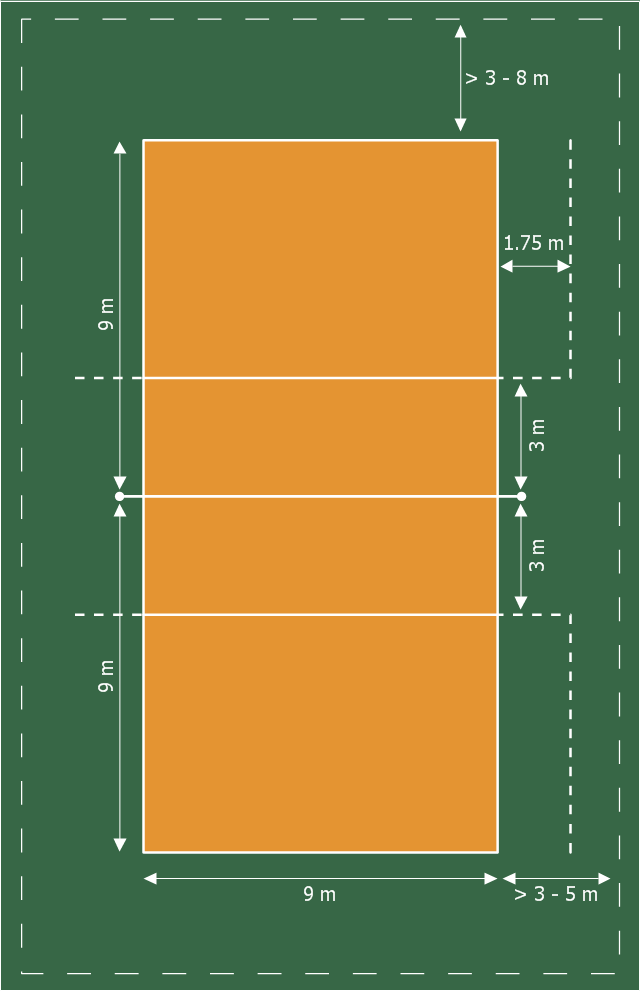
ConceptDraw PRO extended with Pictorial Infographics Solution from the “What are Infographics” Area is a powerful Infographic Software. Make sure in it right now!This sport field plan sample was designed on the base of the Wikipedia file: VolleyballCourt.svg. [en.wikipedia.org/ wiki/ File:VolleyballCourt.svg]
This file is licensed under the Creative Commons Attribution-Share Alike 3.0 Unported license. [creativecommons.org/ licenses/ by-sa/ 3.0/ deed.en]
"Volleyball is a team sport in which two teams of six players are separated by a net. Each team tries to score points by grounding a ball on the other team's court under organized rules. It has been a part of the official program of the Summer Olympic Games since 1964. ...
The court dimensions.
A volleyball court is 18 m (59 ft) long and 9 m (29.5 ft) wide, divided into 9 m × 9 m halves by a one-meter (40-inch) wide net. The top of the net is 2.43 m (8 ft 0 in) above the center of the court for men's competition, and 2.24 m (7 ft 4 in) for women's competition, varied for veterans and junior competitions.
The minimum height clearance for indoor volleyball courts is 7 m (23 ft), although a clearance of 8 m (26 ft) is recommended.
A line 3 m (9.84 ft) from and parallel to the net is considered the "attack line". This "3 meter" (or "10-foot") line divides the court into "back row" and "front row" areas (also back court and front court). These are in turn divided into 3 areas each: these are numbered as follows, starting from area "1", which is the position of the serving player.
After a team gains the serve (also known as siding out), its members must rotate in a clockwise direction, with the player previously in area "2" moving to area "1" and so on, with the player from area "1" moving to area "6".
The team courts are surrounded by an area called the free zone which is a minimum of 3 meters wide and which the players may enter and play within after the service of the ball. All lines denoting the boundaries of the team court and the attack zone are drawn or painted within the dimensions of the area and are therefore a part of the court or zone. If a ball comes in contact with the line, the ball is considered to be "in". An antenna is placed on each side of the net perpendicular to the sideline and is a vertical extension of the side boundary of the court. A ball passing over the net must pass completely between the antennae (or their theoretical extensions to the ceiling) without contacting them." [Volleyball. Wikipedia]
The sport field plan example "Volleyball court dimensions" was created using the ConceptDraw PRO diagramming and vector drawing software extended with the Sport Field Plans solution from the Building Plans area of ConceptDraw Solution Park.
Project management - Design Elements
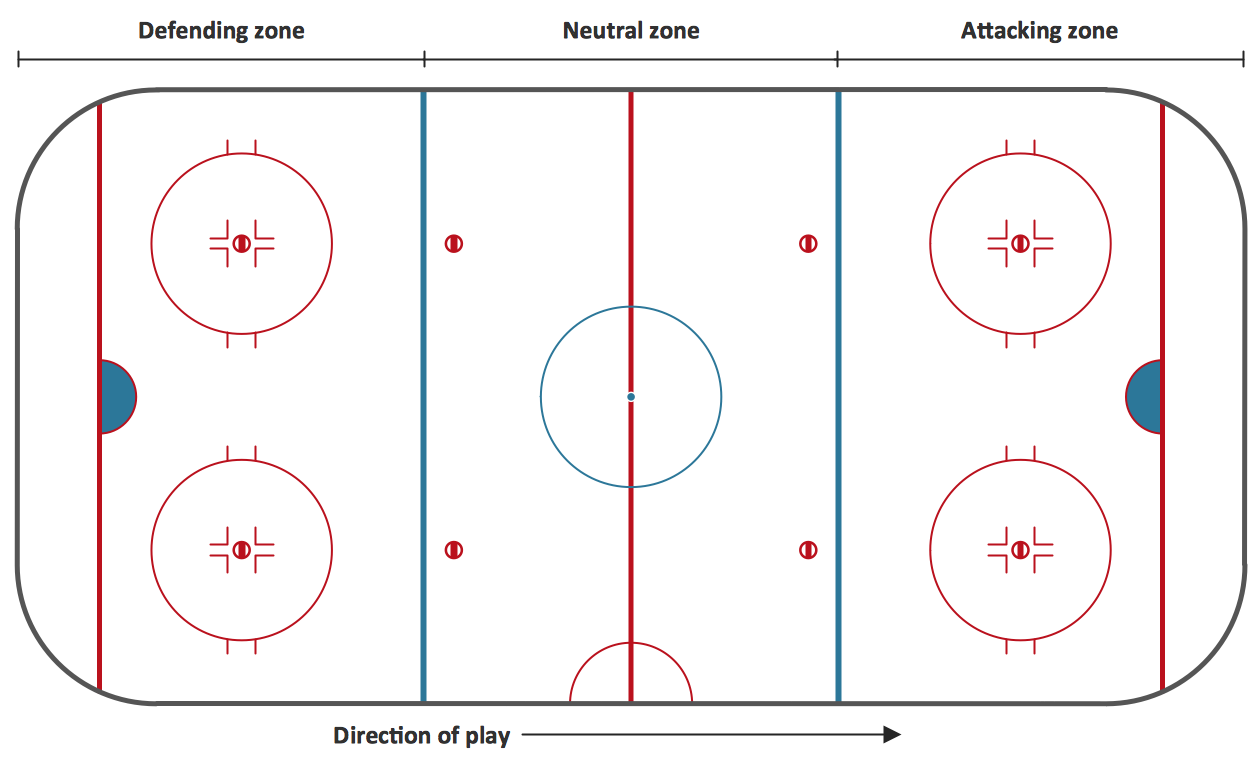
These vector illustrations and cliparts are created using ConceptDraw PRO for drawing the Project management Illustrations and contain plenty of project management design elements. The clipart library Project management includes 35 icons. This symbols used by the best marketing project management software, typically by project management reporting software for presentation on project status and results.Ice Hockey Rink Diagram
The main advantage of using ConceptDraw Ice Hockey Solution is that you don't need to draw objects manually, you have all you need in libraries, templates and samples. This allows you produce professional ice hockey diagrams as quickly as possible, and then post them to blog or social media, print or present on a large screen.Marketing Flow Chart
ConceptDraw PRO diagramming and vector drawing software extended with Marketing Diagrams Solution from the Marketing Area of ConceptDraw Solution Park is the best software for quick and easy creating Marketing Flow Chart of any complexity and design. This charts created to define marketing project stages. In small business project management it sometimes generated by simple marketing project management software. Here is samples which included in Marketing Area of ConceptDraw Solution Park and it can be used as for project planning software as for project management report.Diagram Flow Chart
ConceptDraw PRO is a software for producing flow charts.Software Flow Chart
Many professionals have to solve problems every day. Designing of the process algorithm contribute to understand where the problem is in the process. A Flowchart is a graphical tool that most usable for breaking down processes. Definition of flowchart - a diagram that shows step-by-step progression through a procedure or system especially using connecting lines and a set of conventional symbols. All the icons, symbols and connectors needed for creating standardized notation flowcharts are contained within Software Flow Chart.
 Area Charts
Area Charts are used to display the cumulative totals over time using numbers or percentages; or to show trends over time among related attributes. The Area Chart is effective when comparing two or more quantities. Each series of data is typically represented with a different color, the use of color transparency in an object’s transparency shows overlapped areas and smaller areas hidden behind larger areas.
- Icon Skate Olympics
- Winter Olympic Icons
- Winter Sports. Olympic Games Illustrations. Medal Summary | App ...
- Energy-efficient game console | Winter Sports. Olympic Games ...
- Figure skating - Winter sports pictograms | Icon Teeth
- Winter Olympic Icons Ice Skating
- Design elements - Marketing pictograms | Sport pictograms. Olympic ...
- Silhouette Sport Icon Png
- Sport pictograms. Olympic Games | Design elements - Winter ...
- Design Pictorial Infographics. Design Infographics | Sport ...
- Flow Chart for Olympic Sports | How to Draw a Gantt Chart Using ...
- Olympic Symbol For Figure Skating
- Sport pictograms. Olympic Games | Winter Sports. Using Winter ...
- Flow Chart for Olympic Sports | Winter Sports Vector Clipart. Medal ...
- Skeleton - Winter sports pictograms | Freestyle skiing - Winter sports ...
- Skeleton - Winter sports pictograms | Sochi 2014 Olympics - Men's ...
- Sport pictograms. Olympic Games | Winter Sports. Using Winter ...
- Sport pictograms. Olympic Games | GHS Hazard Pictograms ...
- Short Track Icon
- Sport pictograms. Olympic Games | Flow Chart for Olympic Sports ...
