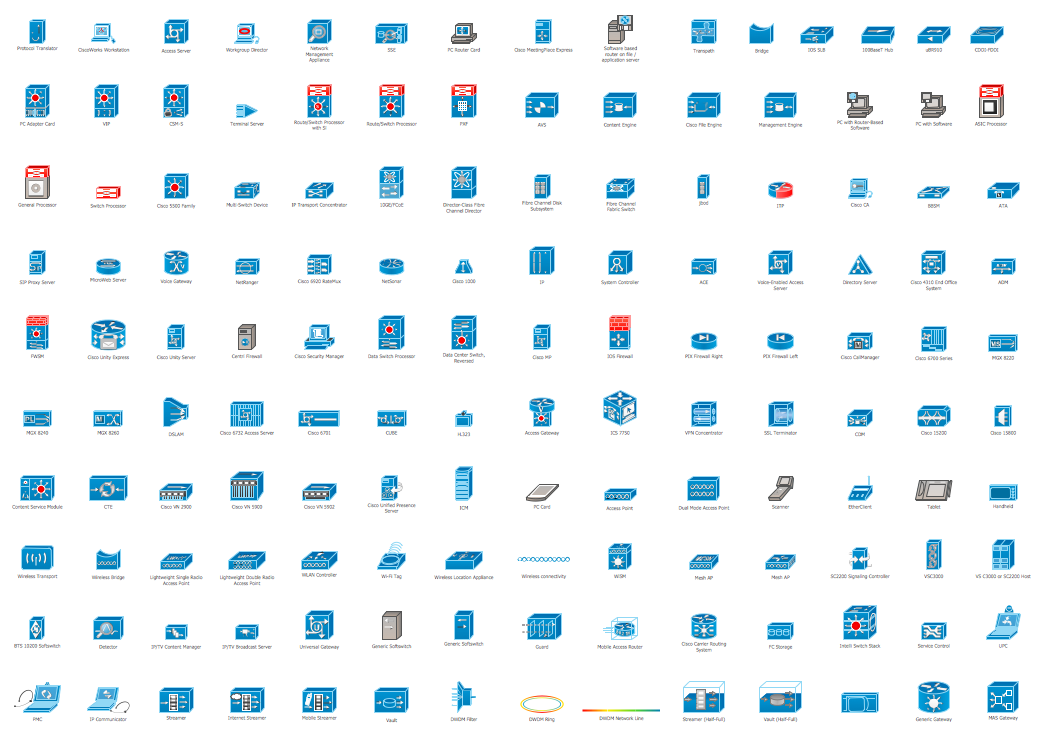
Cisco Products Additional. Cisco icons, shapes, stencils and symbols
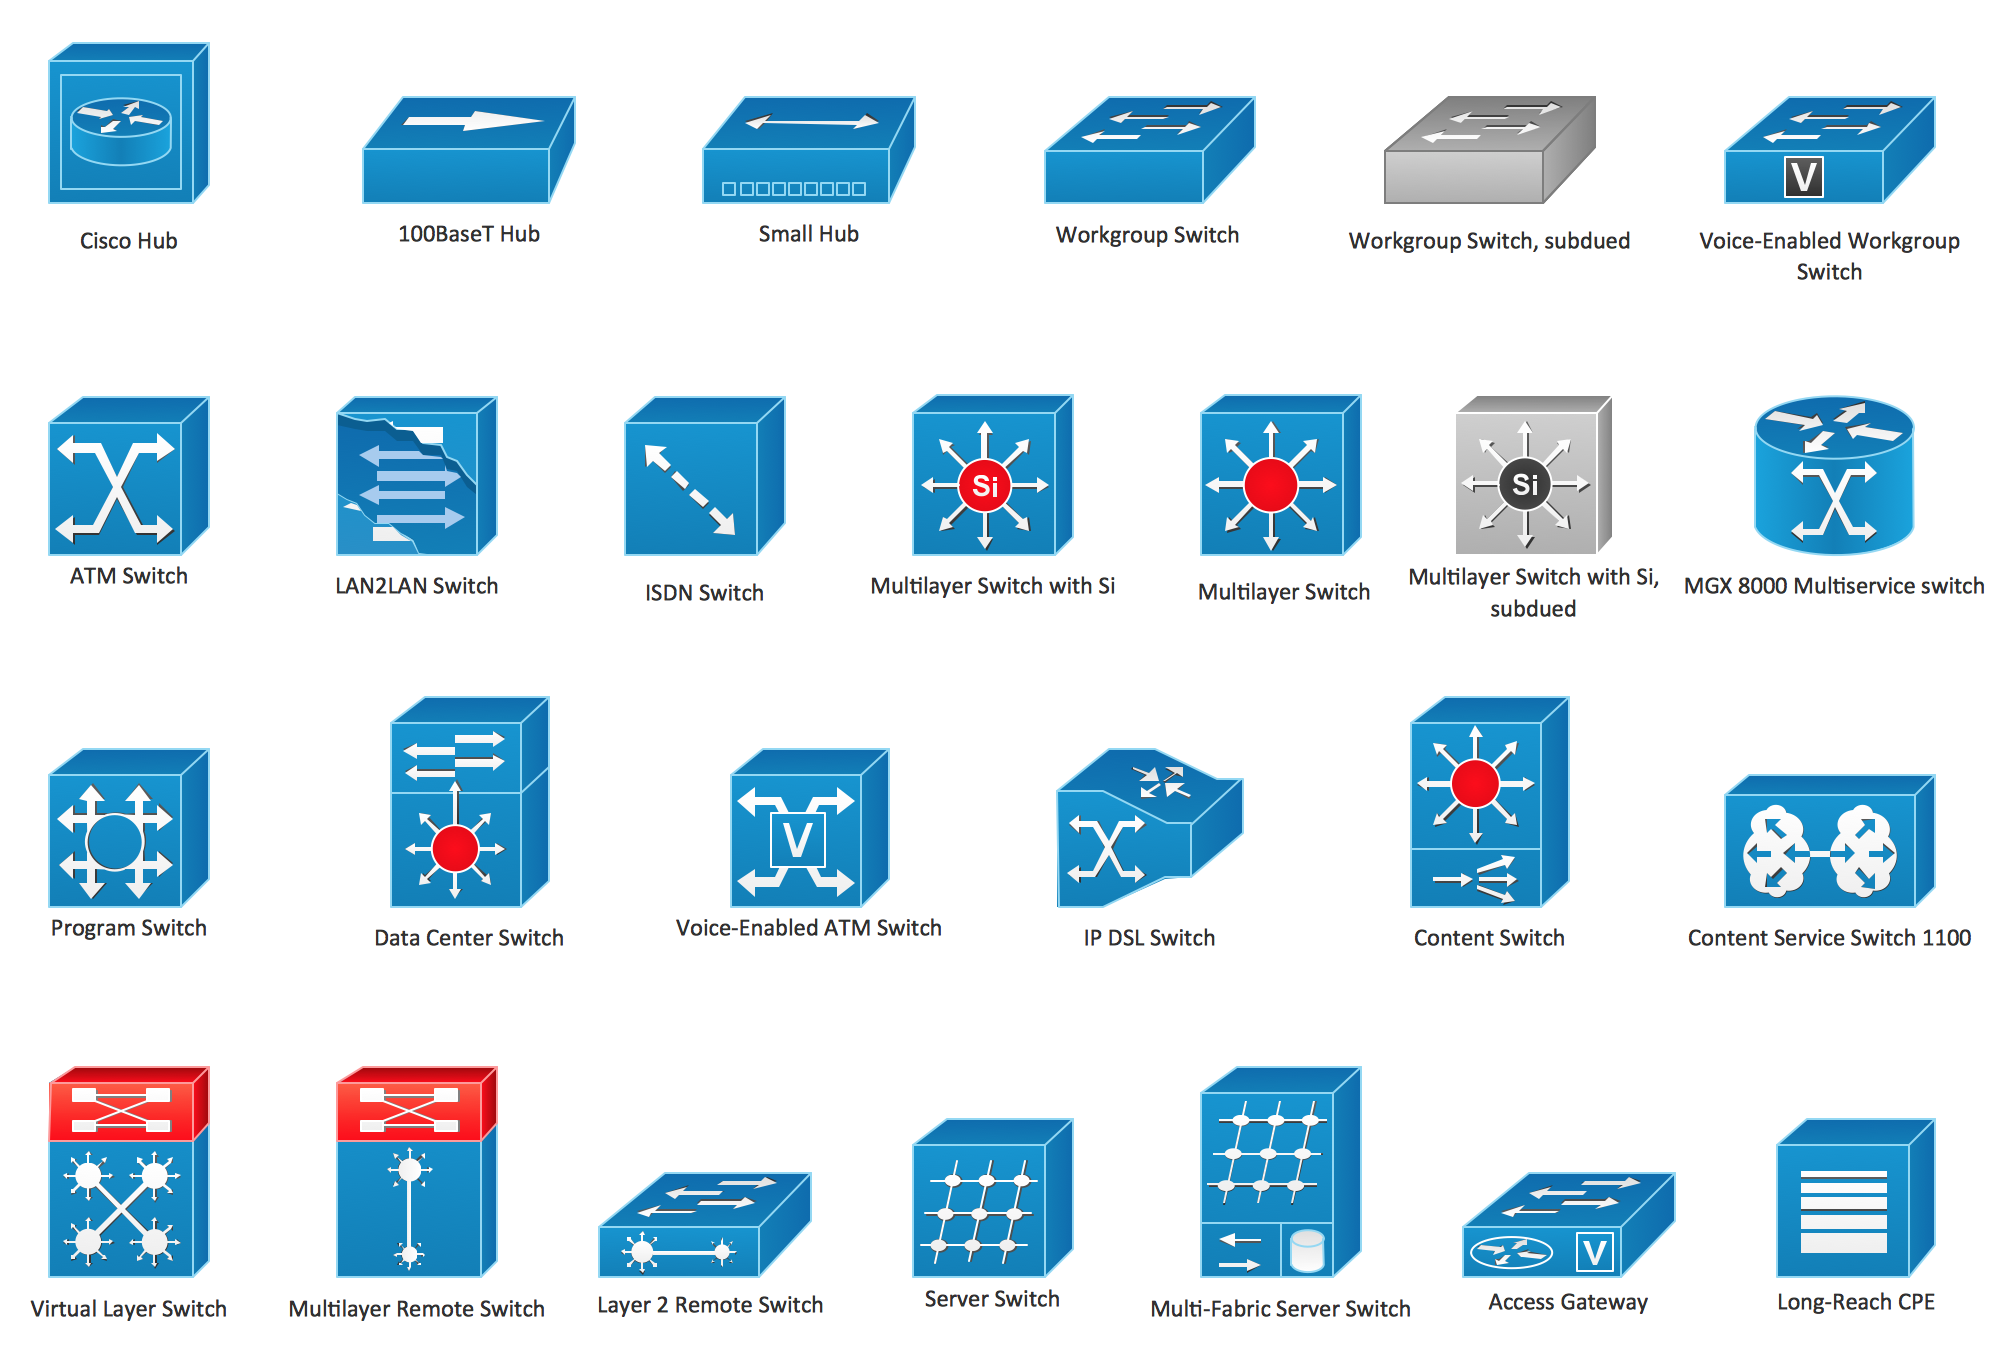
The ConceptDraw vector stencils library Cisco Products Additional contains equipment symbols for drawing the computer network diagrams.Cisco Switches and Hubs. Cisco icons, shapes, stencils and symbols
Cisco switches and hubs deliver the best performance, and often used as network solutions for small businesses, enterprises, data centers. Cisco switches are the core interconnect devices of each computer network. The numerous Cisco switches specifically designed for various applications. Network switches are separated for two types: fixed configuration and modular switches. The fixed configuration switches deprecate swapping or adding another module, and vice versa for modular switch.
 Computer Network Diagrams
Computer Network Diagrams solution extends ConceptDraw DIAGRAM software with samples, templates and libraries of vector icons and objects of computer network devices and network components to help you create professional-looking Computer Network Diagrams, to plan simple home networks and complex computer network configurations for large buildings, to represent their schemes in a comprehensible graphical view, to document computer networks configurations, to depict the interactions between network's components, the used protocols and topologies, to represent physical and logical network structures, to compare visually different topologies and to depict their combinations, to represent in details the network structure with help of schemes, to study and analyze the network configurations, to communicate effectively to engineers, stakeholders and end-users, to track network working and troubleshoot, if necessary.
Example of DFD for Online Store (Data Flow Diagram)
Data Flow Diagram (DFD) is a methodology of graphical structural analysis and information systems design, which describes the sources external in respect to the system, recipients of data, logical functions, data flows and data stores that are accessed. DFDs allow to identify relationships between various system's components and are effectively used in business analysis and information systems analysis. They are useful for system’s high-level details modeling, to show how the input data are transformed to output results via the sequence of functional transformations. For description of DFD diagrams are uses two notations — Yourdon and Gane-Sarson, which differ in syntax. Online Store DFD example illustrates the Data Flow Diagram for online store, the interactions between Customers, Visitors, Sellers, depicts User databases and the flows of Website Information. ConceptDraw DIAGRAM enhanced with Data Flow Diagrams solution lets you to draw clear and simple example of DFD for Online Store using special libraries of predesigned DFD symbols.
Symboles Organigramme
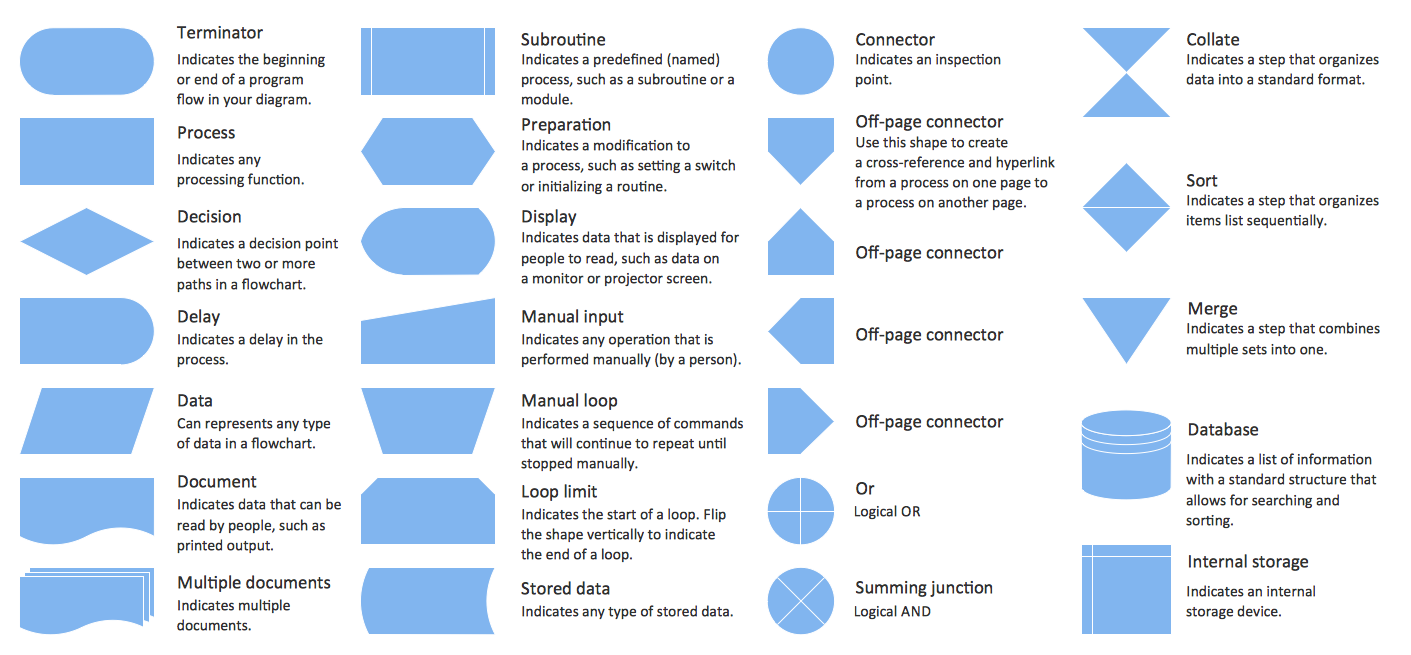
Les organigrammes sont parfaits pour représenter visuellement des processus operationnels. Par exemple, si vous avez besoin d'afficher le flux d'un processus d'ordre personnalisé par l'entremise de divers opérateurs au sein de votre organisation, vous pouvez utiliser un organigramme. Voir aussi d'autres symboles organigramme: Symboles ordinogramme standard, symboles du flux de travail, Vérification Les symboles du schéma fonctionnel, sOrganigramme comptables des symboles, Organigramme de vente des symboles, Symboles pour organigramme des RH, Carte des symboles de processus, Diagramme de processus opérationnels, Symboles utilisés dans le schéma IDEF0.Conception d'organigramme Organigramme des symboles, formes, stencils et icônes
Mavericks a toujours voulu se démarquer, notamment grâce à des choix de design épurés. Les présentations et documents graphiques professionnels sont plus compréhensibles et clairs s'ils utilisent des thématiques de couleurs distinctes pour leurs différentes composantes. La présentation par organigramme rend les démonstrations et les explications de processus opérationnels plus flexibles, et offre un aperçu d'un nouveau genre, se démarquant des organigrammes noir et blanc classiques sur papier. Les meilleures présentations peuvent être obtenues en utilisant les modèles « Conceptdraw » adéquats comme base de départ. Choisissez simplement l'un d'eux et entrez le texte souhaité dans chaque forme du diagramme. Appliquez moins de couleurs dans le document afin de ne pas le transformer en arc-en-ciel, trois ou quatre sera suffiront, notez également que la modélisation des processus opérationnels ne doivent pas contenir des nuances trop claires. Il est aussi- Computer Network Diagrams | Icone Call Center
- Computer Network Diagrams | Icone Agile Scrum Team
- Cisco Routers. Cisco icons , shapes, stencils and symbols | Cisco ...
- Cisco Switches and Hubs. Cisco icons , shapes, stencils and symbols
- Computer Network Diagrams | Example of DFD for Online Store ...
- Cisco Products Additional. Cisco icons , shapes, stencils and symbols
- Cisco Products Additional. Cisco icons , shapes, stencils and symbols
- Cisco Switches and Hubs. Cisco icons , shapes, stencils and symbols
- Cisco Switches and Hubs. Cisco icons , shapes, stencils and symbols
- Agent Wifi Icone Visio
- Production Icone Visio
- Cisco Express Forwarding - Network topology diagram | Cisco ...
- Cisco Network Diagrams
- Recrutement Process Icone Png
- Network Diagramming with ConceptDraw PRO | Network ...
- Cisco switches and hubs - Vector stencils library | Icone Visio Switch ...
- App icons - Vector stencils library | Icone Iphone Email Ios9
- Cisco Routers. Cisco icons , shapes, stencils and symbols | Network ...
- Iphone 7 Camera App Icon
- How To Create Onion Diagram | Basic Flowchart Symbols and ...


