How to Make SWOT Analysis in a Word Document
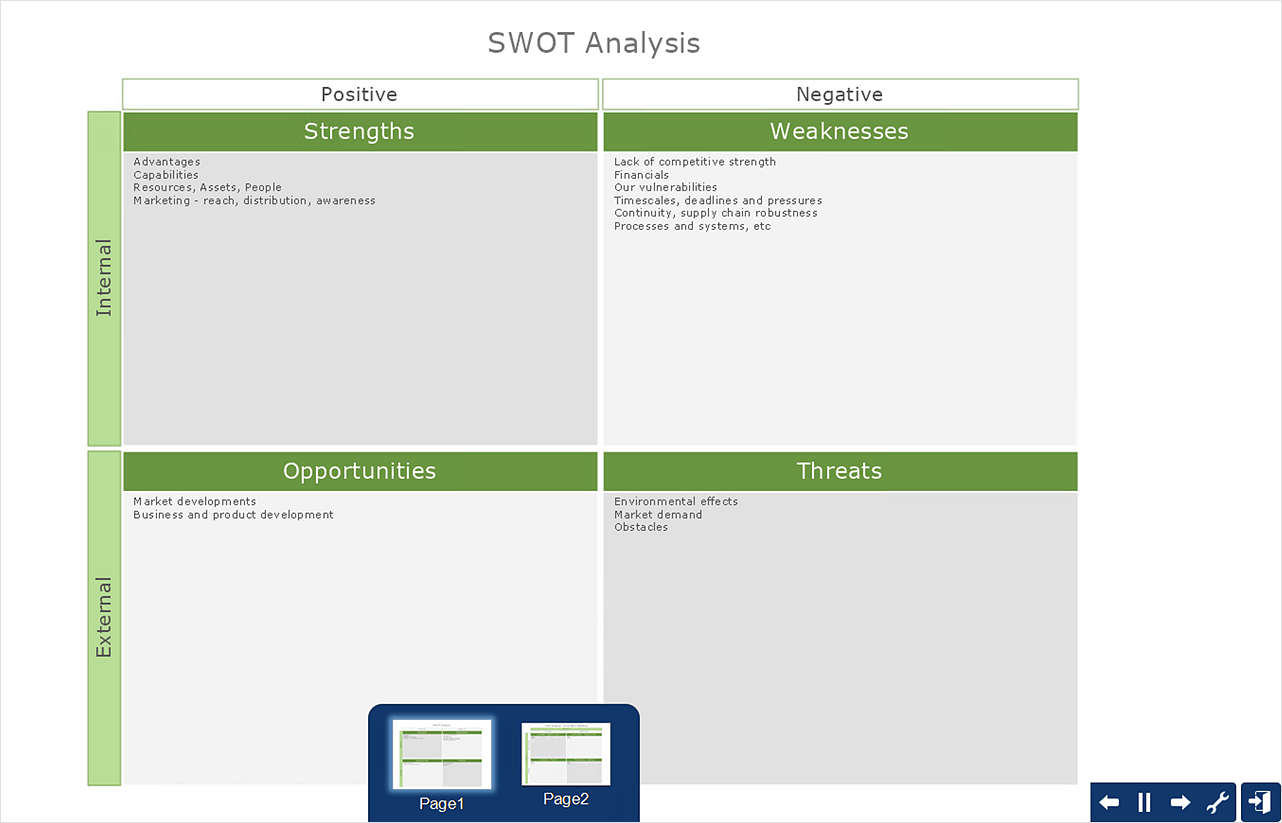
A SWOT Analysis is a popular tool of the strategic planning which is used to evaluate the Strengths, Weaknesses, Opportunities, and Threats that are involved in any businesses. Use of mind maps allows you to collect a lot of information used for SWOT Analysis, visually structure it and also identify the relationships between different parts of this information. SWOT and TOWS Matrix Diagrams solution for ConceptDraw Solution Park combines professional visual advantages of ConceptDraw MINDMAP software and presentation capabilities of ConceptDraw DIAGRAM , which together provide a complete work solution. The SWOT and TOWS diagrams, matrices or mind maps produced in ConceptDraw DIAGRAM using the predesigned vector objects or filling the ready templates, can be then easily exported to Microsoft Word, Microsoft Visio, Microsoft PowerPoint, Adobe PDF, and many other electronic file formats. The possibility of export makes easy the use of SWOT diagrams designed in ConceptDraw DIAGRAM and lets you efficiently collaborate even with people who maybe don't have this software.SWOT Matrix Template
SWOT analysis is a structured planning method, which lets define the objective of the business, internal and external factors favorable or unfavorable for achieving this objective, represent Strengths, Weaknesses, Opportunities, and Threats on the SWOT Matrix. SWOT analysis can be conducted for an industry, company, product, place, or person. It lets to choose the best path for development of an organization, helps to avoid dangers, gives opportunity to establish relationship between the potential of an organization and the problems, lets to assess the values of profitability and compare them with performance of competitors, gives the possibility to expand and enhance the competitive advantages. SWOT and TOWS Matrix Diagrams solution included to ConceptDraw Solution Park contains wide variety of SWOT and TOWS matrix diagrams examples and samples, and also specially developed templates. Each SWOT template have great value in easy and quick drawing of SWOT matrices and diagrams in ConceptDraw DIAGRAM diagramming and vector drawing software for Mac OSX and Windows.Mind Maps for Business - SWOT Analysis
SWOT analysis is a planning method and the best way for effective exploring four major aspects for a business or a venture - strengths, weaknesses, opportunities and threats. Visually SWOT analysis results are depicted as a SWOT matrix, diagram or Mind Map, which is then included to the set of documents, report or in presentation devoted to demonstration the results of realized SWOT analysis for directors, shareholders, and other interested employees. ConceptDraw Solution Park includes the SWOT and TOWS Matrix Diagrams solution, which offers wide possibilities for realization SWOT analysis and creation SWOT Matrices and SWOT Mind Maps in ConceptDraw DIAGRAM and ConceptDraw MINDMAP software. This solution includes fully ready-to-use SWOT vector design elements, SWOT matrix samples and also useful templates that allow users create own SWOT diagrams and Mind Maps for business SWOT analysis in a few minutes. Use also the perfect ability of instantly exporting to various formats and of creation MS PowerPoint presentation right from the ConceptDraw applications.HelpDesk
How to Create SWOT Analysis Template
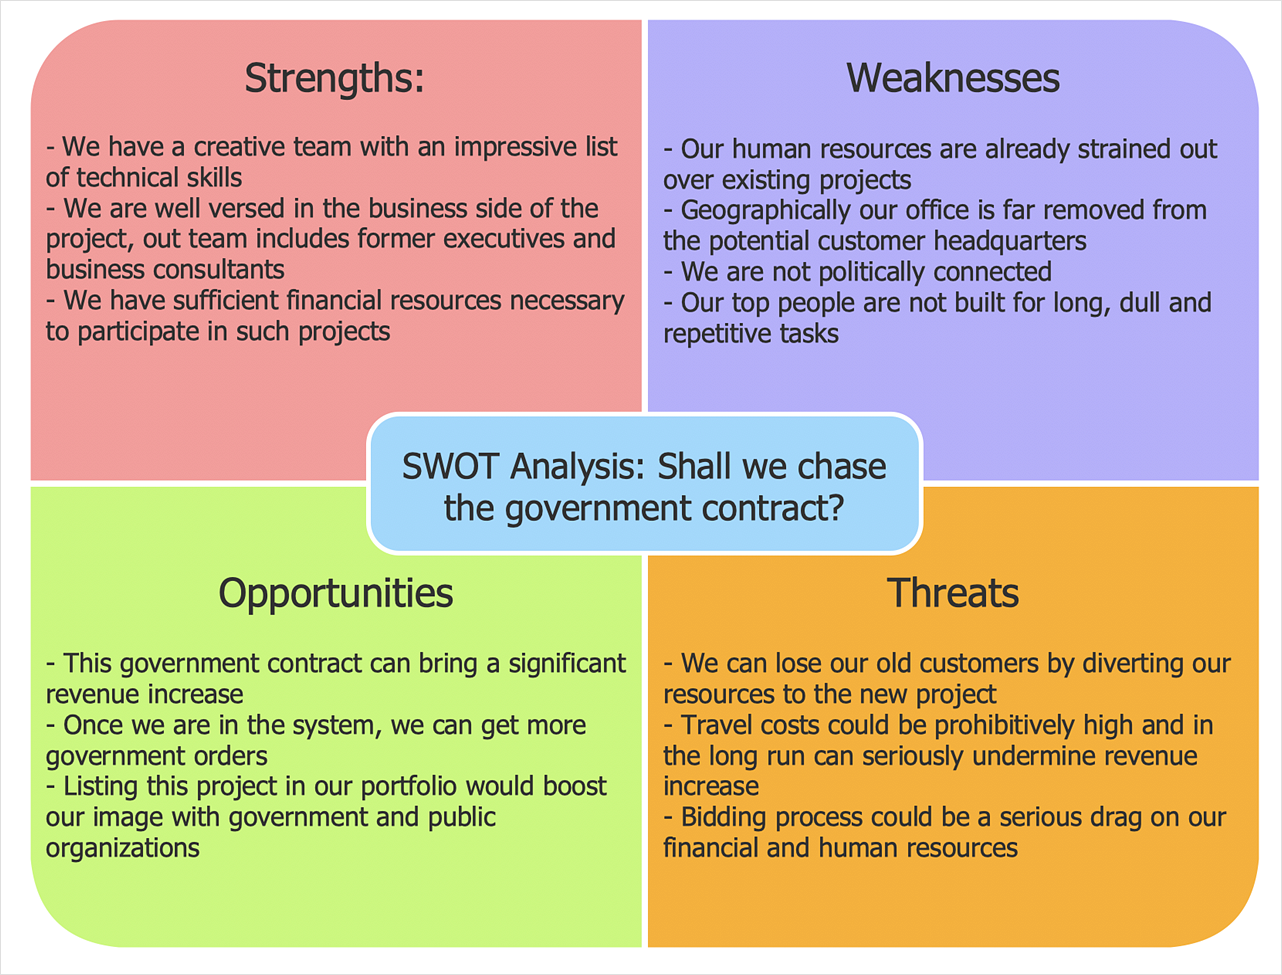
SWOT-analysis is used to develop a marketing strategy. SWOT-analysis includes determining the strengths and weaknesses of the company's activity, potential external threats, and opportunities and assesses their relative strategic competitors. ConceptDraw SWOT and TOWS Matrix Diagrams solution provides a set of SWOT matrix in which should be recorded and then compared the strengths and weaknesses of the enterprise and the market opportunities and threats. This comparison allows you to determine what steps can be taken for the development of your company and what problems need to be addressed urgently.SWOT Analysis
Most of the data needed for market analysis (demand, prices, volume of sales, etc.) are undefined, and in future are possible their changes as in the worst and the best side. SWOT analysis is effective method for prediction these processes and decision making for organizations that function in a competitive environment. It allows you to see the whole situation, to identify the strengths and weaknesses of organization (advantages and disadvantages), as well as opportunities and threats of external environment. The results of SWOT analysis are the basis for optimization the business processes, for development by the leading specialists in organization of interrelated complex of strategies and competitive activities. ConceptDraw DIAGRAM software enhanced with SWOT and TOWS Matrix Diagrams Solution will effectively help you in strategic planning for your company, department, project, in development marketing campaign, in identification of four categories of factors of internal and external environment of organization, and construction professional-looking SWOT and TOWS matrices.
 SWOT and TOWS Matrix Diagrams
SWOT and TOWS Matrix Diagrams solution extends ConceptDraw DIAGRAM and ConceptDraw MINDMAP software with features, templates, samples and libraries of vector stencils for drawing SWOT and TOWS analysis matrices and mind maps.
HelpDesk
How to Create a SWOT Matrix Quickly
ConceptDraw DIAGRAM allow create SWOT Matrix in just one click for presenting analysis results preformed in mimd map structure using ConceptDraw MINDMAP.CCTV Network Example
The following examples cctv network were created in ConceptDraw DIAGRAM diagramming and vector drawing software using the Audio, Video, Media Solution. Using this easily customizable cctv network template you can represent any existing cctv network.TOWS Matrix
TOWS Matrix is an effective tool which allows to analize the external opportunities and threats by means of analyzing the internal strengths and weaknesses of a company. ConceptDraw DIAGRAM diagramming and vector drawing software extended with SWOT and TOWS Matrix Diagrams Solution from the Management Area will help design TOWS Matrix for your company without efforts.Project management - Design Elements
These vector illustrations and cliparts are created using ConceptDraw DIAGRAM for drawing the Project management Illustrations and contain plenty of project management design elements. The clipart library Project management includes 35 icons. This symbols used by the best marketing project management software, typically by project management reporting software for presentation on project status and results.
 Illustration
This solution extends ConceptDraw DIAGRAM.4, allowing you to make professional-looking documents, presentations and websites illustrated with color, scalable vector clip art and shapes, regardless of drawing skills.
Pictures of Vegetables
Designing of food images, fruit art illustrations, pictures of vegetables, and many other food and cafe related images and infographics has never been easier than it is now with ConceptDraw DIAGRAM software. ConceptDraw DIAGRAM diagramming and vector drawing software extended with Food Court solution from the Food and Beverage area of ConceptDraw Solution Park is perfect food pictures design software.Marketing Analysis Diagram
An example of marketing analysis diagram, can be used to analyse product market and define marketing strategy. This types of charts used by small business project management for making presentations on market shares, it used by marketing project management software and project management tracking tools for reporting results and statuses.Ice Hockey Diagram — Defensive Strategy — Neutral Zone Trap
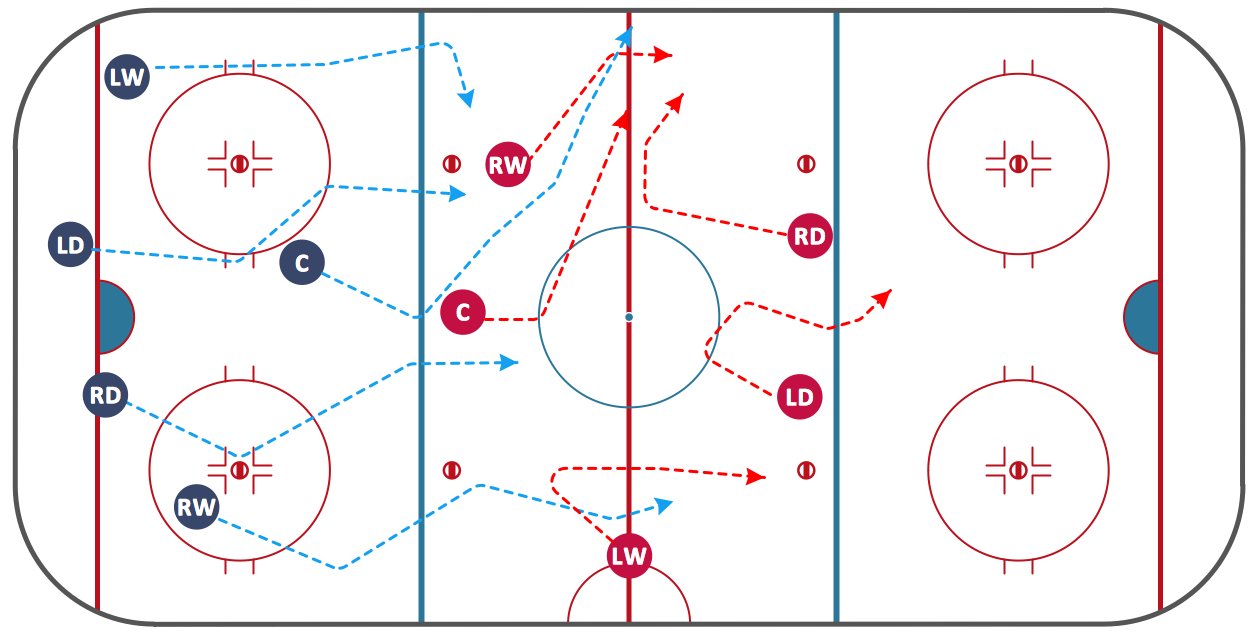
In ConceptDraw DIAGRAM you can produce ice hockey diagrams of any complexity for any presentaion needs, using a combination of tools. To adopt the sample below for presentation needs place positions and arrows onto different layers of your document and then make them visible one by one during a presentation.- Example Of Personal Swot Analysis Of A Student
- Personal Swot Analysis Example Student
- Personal Swot Analysis Of A Student
- Entity-Relationship Diagram (ERD) | Education | Illustration | Swot ...
- Education | Entity-Relationship Diagram (ERD) | Illustration | Swot ...
- Entity-Relationship Diagram (ERD) | Education | Illustration | Swot ...
- Illustration | Artwork | Nature | Animals Swot Analysis Of A Lion
- Education | Entity-Relationship Diagram (ERD) | Illustration | Swot ...
- SWOT Analysis | How to Create SWOT Analysis Template Using ...
- SWOT Analysis | SWOT and TOWS Matrix Diagrams | How to Create ...
- SWOT and TOWS Matrix Diagrams | How to Make SWOT Analysis in ...
- Example Personal Artist Swot Analysis Example
- SWOT Analysis | SWOT Sample in Computers | Fishbone Diagram ...
- How to Create a PowerPoint Presentation from a SWOT Analysis ...
- Swot Analysis For Engineering Students Examples
- SWOT Sample in Computers | SWOT Analysis | How to Make SWOT ...
- SWOT Analysis | Holiday | ConceptDraw Solution Park | Swot ...
- SWOT Analysis | Fishbone Diagram | Value Stream Mapping | Swot ...
- SWOT Sample in Computers | SWOT Analysis | Fishbone Diagram ...
- Example Of Swot Analysis Of A Finance Student


