HelpDesk
How to Get Images for Project Presentation on Windows
ConceptDraw PROJECT allows you to easily make slides for presentation.Process Flowchart
The main reason of using Process Flowchart or PFD is to show relations between major parts of the system. Process Flowcharts are used in process engineering and chemical industry where there is a requirement of depicting relationships between major components only and not include minor parts. Process Flowcharts for single unit or multiple units differ in their structure and implementation. ConceptDraw PRO is Professional business process mapping software for making Process flowcharts, Process flow diagram, Workflow diagram, flowcharts and technical illustrations for business documents and also comprehensive visio for mac application. Easier define and document basic work and data flows, financial, production and quality management processes to increase efficiency of your business with ConcepDraw PRO. Business process mapping software with Flowchart Maker ConceptDraw PRO includes extensive drawing tools, rich examples and templates, process flowchart symbols and shape libraries, smart connectors that allow you create the flowcharts of complex processes, process flow diagrams, procedures and information exchange. Process Flowchart Solution is project management workflow tools which is part ConceptDraw Project marketing project management software. Drawing charts, diagrams, and network layouts has long been the monopoly of Microsoft Visio, making Mac users to struggle when needing such visio alternative like visio for mac, it requires only to view features, make a minor edit to, or print a diagram or chart. Thankfully to MS Visio alternative like ConceptDraw PRO software, this is cross-platform charting and business process management tool, now visio alternative for making sort of visio diagram is not a problem anymore however many people still name it business process visio tools.
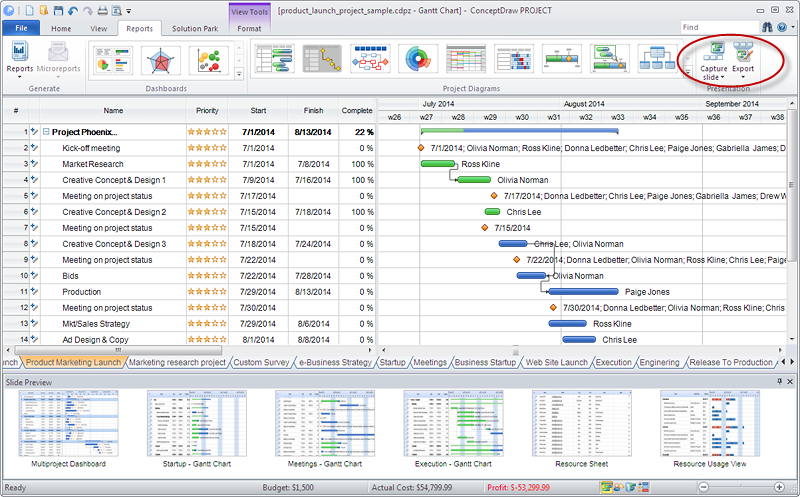
How to Create Presentation of Your Project Gantt Chart
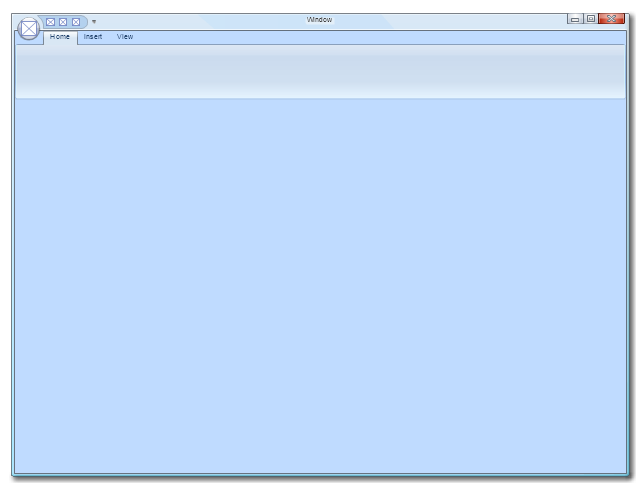
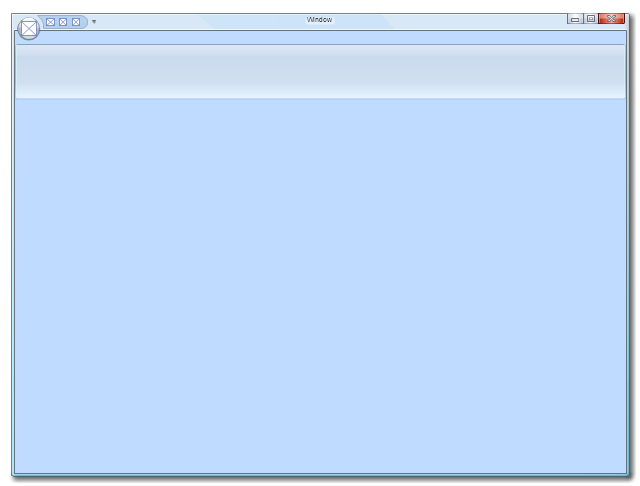
During the planning, discussing and execution of a project you may need to prepare a presentation using project views such as the Gantt Chart, Multiproject Dashboard or Resource Usage View. It’s easy do with ConceptDraw PROJECT!The vector stencils library "Ribbon interface" contains 41 ribbon shapes.
Use it for designing Microsoft ribbon graphic user interface (GUI) of software for Windows computers in the ConceptDraw PRO diagramming and vector drawing software extended with the Graphic User Interface solution from the Software Development area of ConceptDraw Solution Park.
Use it for designing Microsoft ribbon graphic user interface (GUI) of software for Windows computers in the ConceptDraw PRO diagramming and vector drawing software extended with the Graphic User Interface solution from the Software Development area of ConceptDraw Solution Park.
The vector stencils library "General window elements" contains 31 window elements.
Use this window UI icon set to design graphic user interface (GUI) of your software application for OS X 10.10 Yosemite Apple Mac operating system.
The example "General window elements - Vector stencils library" was created using the ConceptDraw PRO diagramming and vector drawing software extended with the Mac OS User Interface solution from the Software Development area of ConceptDraw Solution Park.
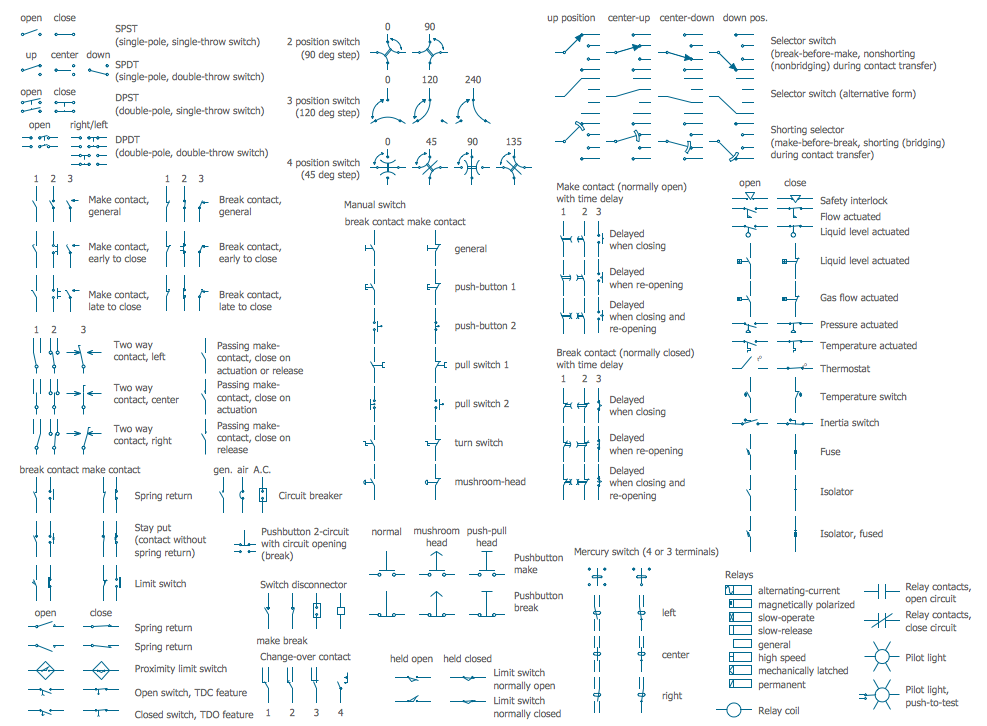
Electrical Symbols — Switches and Relays
In electrical engineering, a switch is an electrical component that can break an electrical circuit, interrupting the current or diverting it from one conductor to another. The mechanism of a switch may be operated directly by a human operator to control a circuit (for example, a light switch or a keyboard button), may be operated by a moving object such as a door-operated switch, or may be operated by some sensing element for pressure, temperature or flow. A relay is a switch that is operated by electricity. Switches are made to handle a wide range of voltages and currents; very large switches may be used to isolate high-voltage circuits in electrical substations. 26 libraries of the Electrical Engineering Solution of ConceptDraw PRO make your electrical diagramming simple, efficient, and effective. You can simply and quickly drop the ready-to-use objects from libraries into your document to create the electrical diagram.The vector stencils library "Wireframe" contains 18 wireframe design elements.
Use it for designing wireframe graphic user interface (GUI) of computer software in the ConceptDraw PRO diagramming and vector drawing software extended with the Graphic User Interface solution from the Software Development area of ConceptDraw Solution Park.
Use it for designing wireframe graphic user interface (GUI) of computer software in the ConceptDraw PRO diagramming and vector drawing software extended with the Graphic User Interface solution from the Software Development area of ConceptDraw Solution Park.
HelpDesk
How to Create a Picture Graph
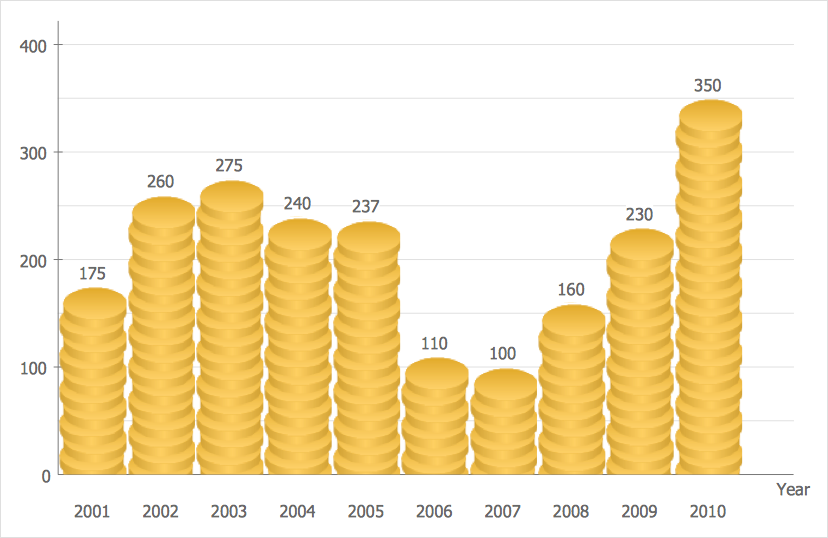
Picture Graphs are used commonly to represent non-complex data to a large audience. A Picture Graph is simple kind of marketing diagram used to show the relationship among various quantities. It include pictures or symbols to represent information visually. There are many cases when you have just some numbers to show and compare. This is not a reason to not use visual tools. You can produce a simple picture graph using memorable symbols to get the best visual presentation. Using specific symbols instead of regular colored bars makes picture graphs a much more descriptive tool. You can use tools from an existing library or find appropriate clipart in ConceptDraw’s collection. ConceptDraw PRO allows you to draw a simple and easy to understand Graph Charts using the special library.HelpDesk
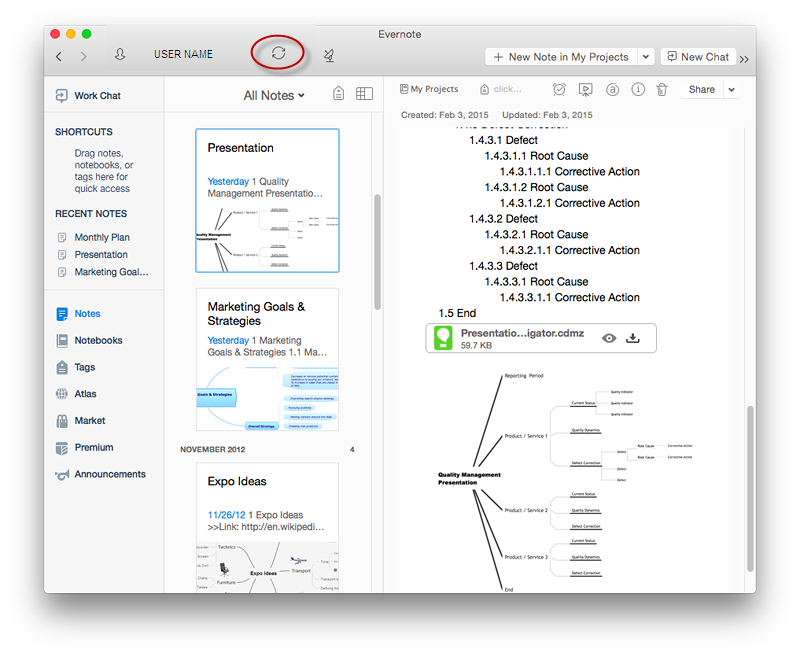
How to Send a Mind Map to Evernote
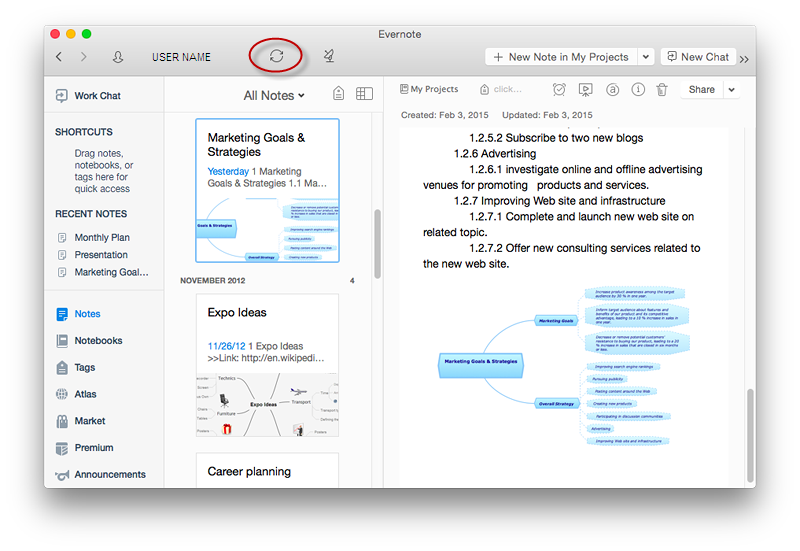
The Note Exchange solution lets you to publish a mind map, created with ConceptDraw MINDMAP to your Evernote account.Swim Lane Diagrams
Swim Lane Diagrams are the kind of process flow diagrams and effective tool for documenting the business processes required for any business company for its productive work, for easy defining the weak points, reasons of defects, or delays during the process. Swim Lane Diagram is based on the IDEF3 standard and was developed primarily for using in projecting. Its name derives from the use of horizontal or vertical lanes. The blocks that denote the parts of the processes are arranged within definite lanes according to the belonging to responsible worker. So the process of any complexity is visually divided into the parts and represented with indication the responsibility for execution of each part. This significantly facilitates the comprehension of its work. Use the ConceptDraw PRO software and predesigned vector objects from the Swim Lanes library of Business Process Mapping Solution included to ConceptDraw Solution Park to easy develop Swim Lanes Flowcharts and Diagrams, for modeling and documenting the business processes in a simple and visual graphic form.Electrical Diagram Software
Electrical engineering and electronic engineering are extensive fields dedicated to research, design, development, manufacturing, test, and montage of systems and devices of electricity, electronics, microelectronics, telecommunications, power engineering, etc. These fields use various types of schemes, diagrams, technical drawings and require a special precision, accuracy and attention at their construction and using. The availability of modern specialized software has great importance for electrical engineers and electronic specialists, it assists them in drawing Electrical schematics and diagrams, Electrical drawings and Wiring schemes, Electronic Circuit schematics, etc. One of such software is ConceptDraw PRO extended with Electrical Engineering Solution that offers powerful drawing tools, wide variety of samples and libraries with numerous quantity of predesigned electrical symbols and vector objects of electrical devices. All they help design with minimal efforts Electrical diagrams and blueprints of any complexity, now drawing process is easy even for beginners.
 Fishbone Diagram
Fishbone Diagrams solution extends ConceptDraw PRO software with templates, samples and library of vector stencils for drawing the Ishikawa diagrams for cause and effect analysis.
HelpDesk
How to Send a Mind Map File to Evernote?
The Note Exchange solution lets you to send a document, created with ConceptDraw MINDMAP to your Evernote account.
 Sales Flowcharts
The Sales Flowcharts solution lets you create and display sales process maps, sales process workflows, sales steps, the sales process, and anything else involving sales process management.
HelpDesk
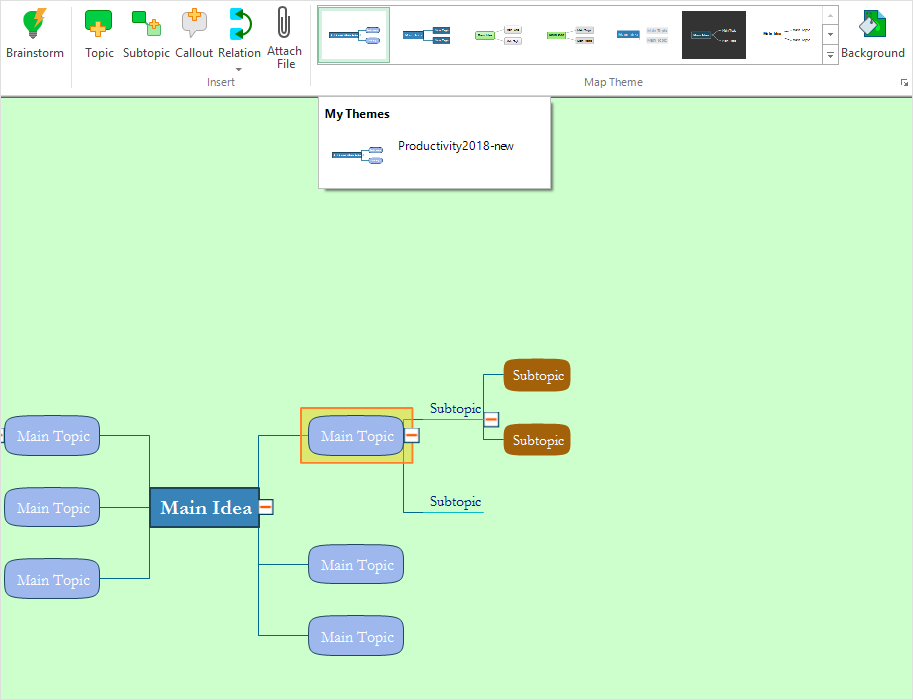
How to Customize the Style of Your Mind Map
Tips on how to modify or create your own mind map theme and then use it for a new map?- Basic Flowchart Symbols and Meaning | Radio Button Image Blue Png
- Minimize Button Rectangle Down Arrow Png Icon
- Image Separator Png
- Down Button Png
- Inputbox Png
- Close Window Button Png
- Cloud round icons - Vector stencils library | Contactlist Background ...
- Banner Png Image
- Drop Down Png Image
- Android Star Png
- Separator Vertical Png
- Slider Bar Png Images
- Png Edit Text
- Image Button Icon For Farmer
- List Style Image Png
- Images Png Button
- Dropdown Png
- Vertical White Line Transparent Png
- Png Photo Modal
- Background Images Ppt In Png Transparent










-ribbon-interface---vector-stencils-library.png--diagram-flowchart-example.png)





-ribbon-interface---vector-stencils-library.png--diagram-flowchart-example.png)
-ribbon-interface---vector-stencils-library.png--diagram-flowchart-example.png)
-ribbon-interface---vector-stencils-library.png--diagram-flowchart-example.png)






























-wireframe---vector-stencils-library.png--diagram-flowchart-example.png)

