HelpDesk
How to Input Data from MS Excel Into a Mind Map
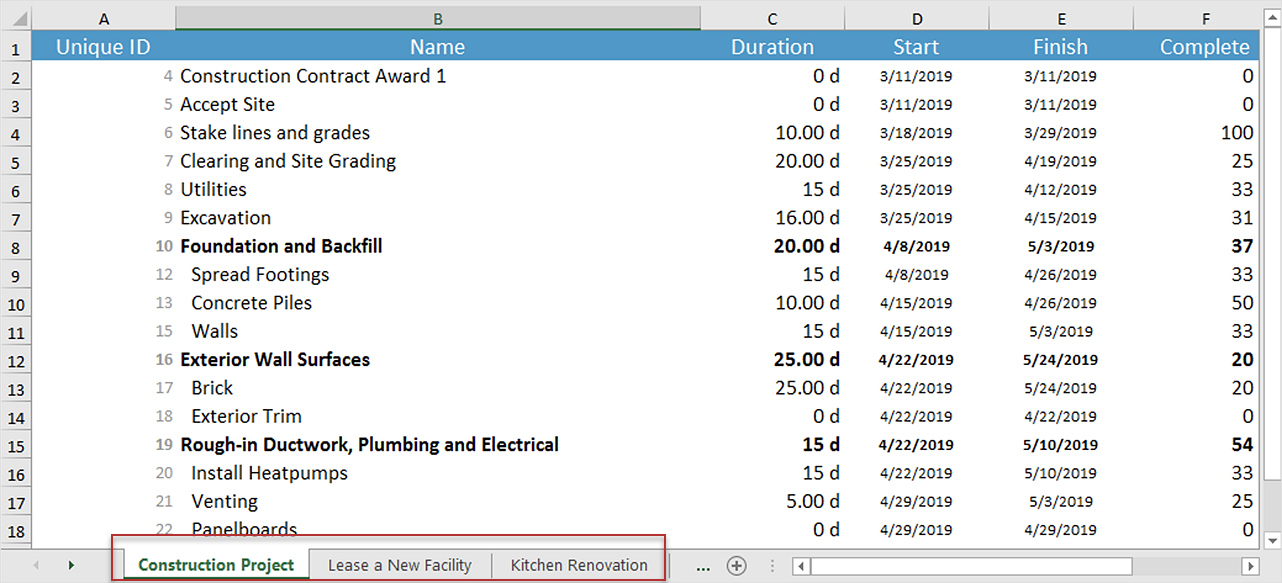
Many people apply Excel documents to store data in the form of hierarchical lists. With ConceptDraw MINDMAP you can easily turn the linear structure of an Excel table in a radial structure of mind map ConceptDraw MINDMAP will create a mind map file (CDMZ) from your Excel (XLS) file. If you keep your information in the Microsoft Excel files, you can import them into ConceptDraw MINDMAP, converting the columns and rows to a hierarchically structured mind map. If you have multiple individual sheets in your Excel workbook, ConceptDraw MINDMAP will turn them into a single multi-page mind map. ConceptDraw MINDMAP lets you import an entire Microsoft® Excel file as well as insert data from the selected cells.How to exchange data files of major mind mapping software?
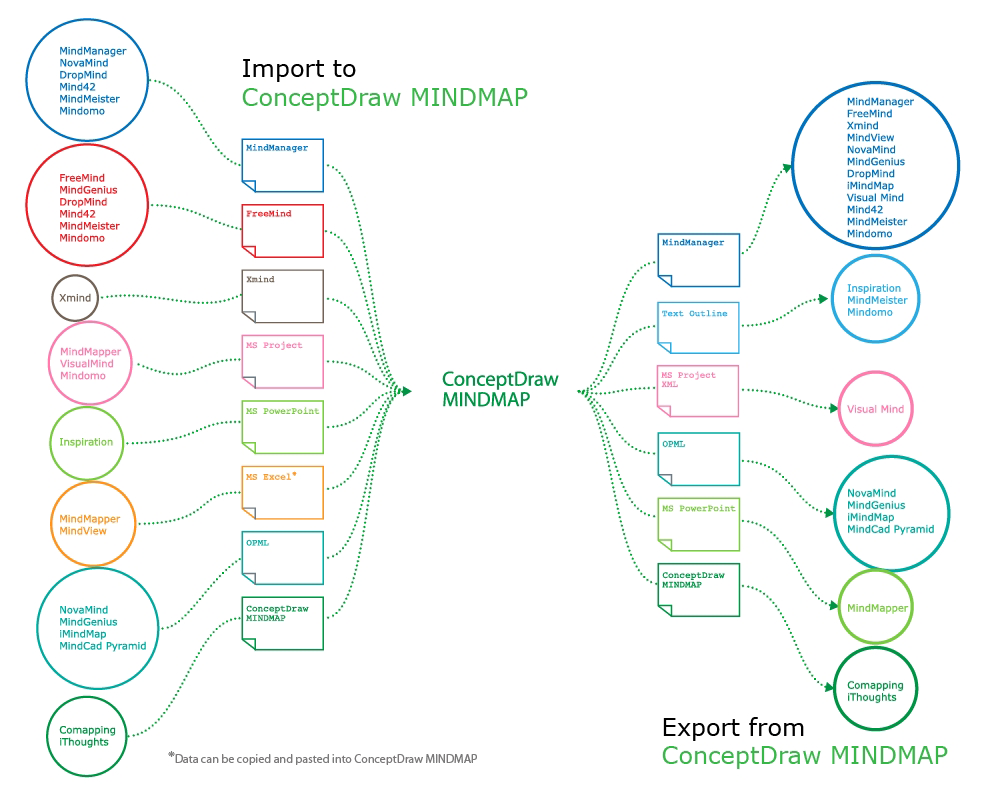
ConceptDraw MINDMAP software included to powerful ConceptDraw Office suite is applied for professional creation the Mind Maps, for effective managing the communications within the work group or team, for holding brainstorming sessions. The ability of exchanging the documents and files of different types, including Mind Maps is very useful for users that need to collaborate, but apply varied applications in their work. ConceptDraw MINDMAP supports the export to many Microsoft Office products, such as MS Word, MS PowerPoint, MS Project, as well as export to PDF, HTML, Evernote, Apple iCal, and different graphic format files. The Mind Map Exchange solution from the Collaboration area of ConceptDraw Solution Park makes the ConceptDraw MINDMAP software powerful in questions of exchanging the Mind Maps with large variety of major mind mapping applications, including Mindjet MindManager, FreeMind, XMind. If you can't to find some file format you need at the import / export list, you can refer to the third party applications to import or export the files through them.HelpDesk
How to Create a Time Series Dashboard
Time Series Dashboard means integration of some type of diagrams: Line Charts, Bar Charts, Column Charts, and Dot Plots on a single space. The ConceptDraw Time Series Dashboard solution can be used to create the interactive Time Series dashboard. The libraries of Time Series Charts solution contain the Live Objects, that can change their appearance depending on the external data. Each chart from the Time Series dashboard displays particular source data. You can include Time Series Charts in your business or technical dashboards to show and compare the items changing over time.HelpDesk
How to Create a PowerPoint Presentation from a SWOT Matrix
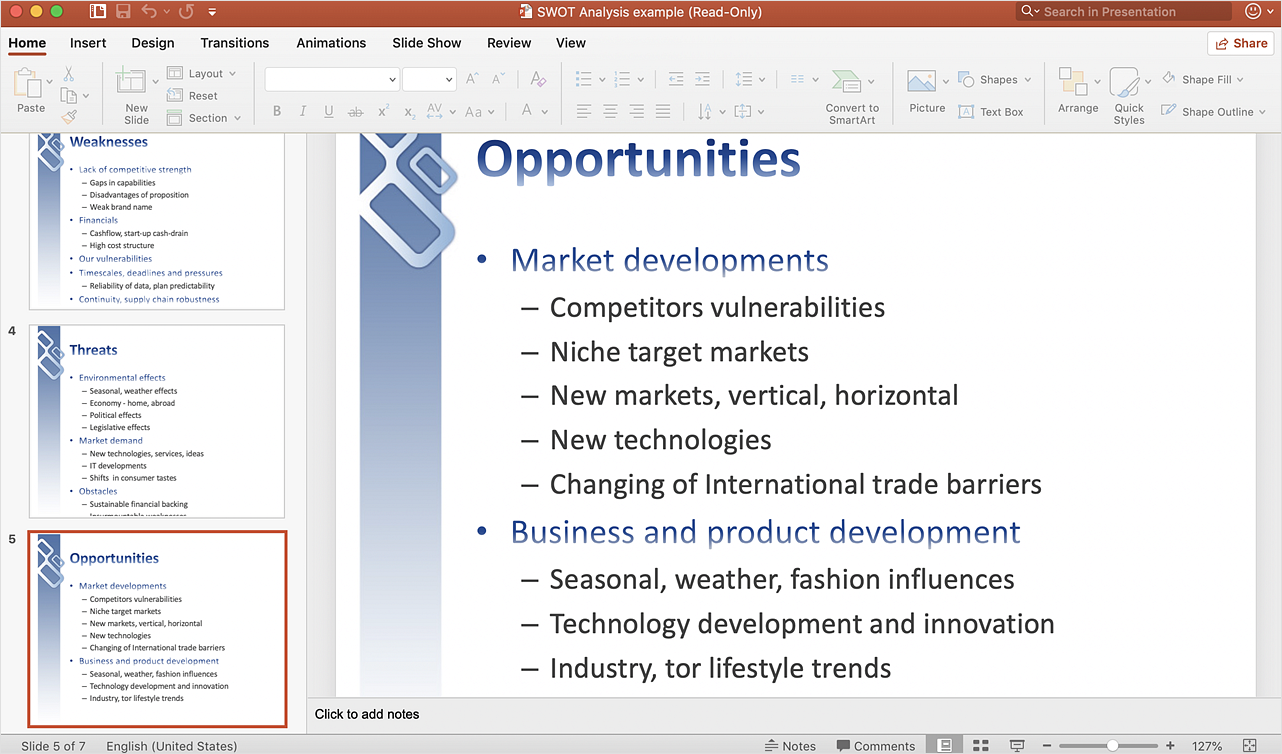
You can use SWOT analysis PowerPoint presentation to represent strengths, weakness, opportunities, and threats involved in your SWOT matrix. We recommend using ConceptDraw MINDMAP for identifying and structuring factors employed in SWOT Analysis. Then, you can export the SWOT Matrix to PowerPoint slides.HelpDesk
How to Insert a Mind Map into Microsoft Word Document
ConceptDraw MINDMAP offers several options of converting your mind map to MS Word document. You can choose the proper format that meets your needs to communicate the content of your mind maps. Generate text, presentations, images or web pages that are pertinent to your work. Primary, you can export a mind map to MS Word. This method allows stylizing the document by using a custom MS Word templates. If you need to combine text and hierarchically structured information in a single document, the best solution is to incorporate a mind map into the MS Word document using the copy-paste capabilities of ConceptDraw MINDMAP.HelpDesk
How to Make a Mind Map in PowerPoint
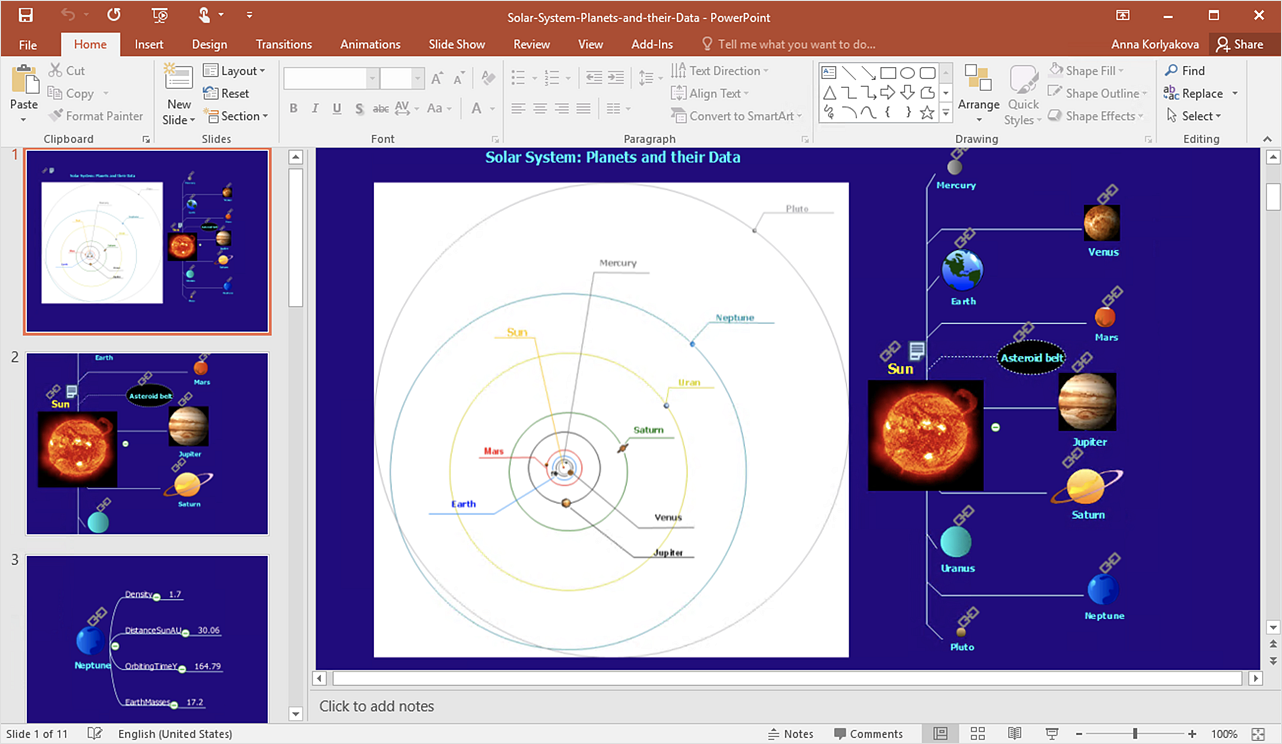
ConceptDraw MINDMAP allows you to create a traditional PowerPoint Presentation from your mind maps. You can create great PowerPoint slides from your mind maps.HelpDesk
How to Report on Multiple Projects Status
Reporting on project status is an important part of project management. A project manager has to generate systematic reports on project progress concerning schedule, scope, and budget. Project progress reports made orderly, form a notation of current project status. Once a project manager has been assigned to a number of projects running simultaneously, a variety of business issues come up, such as: what kind of projects have already been launched, and what is their status? The reporting facilities of ConceptDraw PROJECT are actually dramatic. The following article is created to let you find out how to generate reports on multiple projects using ConceptDraw PROJECT standard reporting pack.HelpDesk
How to Generate Tabular Reports in ConceptDraw PROJECT for macOS
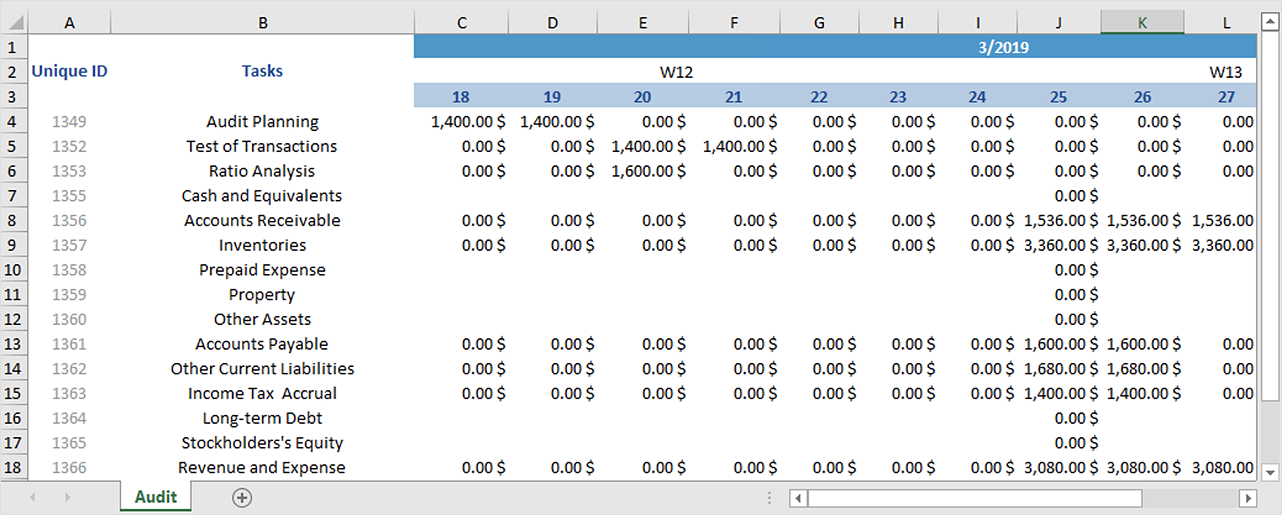
Project reporting is one of the key functions of effective project management. Using regular project reports, project manager can constantly track and analyze the project’s execution. This analytic process can help to ensure that the team reaches the best possible solutions. ConceptDraw PROJECT is a professional software tool for project management with the advanced mechanism of reporting. You can create the set of regular reports on project activities, task statuses, cash flow and assignments in MS Excel format. Mind map reports are also available.Flowchart Software
Flowchart is a simple diagram, map or graphical schematic representation the sequence of actions within a process. It is ideal for displaying how a process currently flows or can function ideally. The Flowcharts let define the steps and boundaries of a process, uncover problems or miscommunications. The Flowcharts are widely used in education, software development, business, economics, thanks to their visuality they are ideal for presentations, reports, for using on conferences to help the audience comprehend the content better, or easy find flaws in a process flow diagrams. ConceptDraw DIAGRAM is professional flowcharts software and feature-rich flowchart maker, which supports Mac OS X and Windows. It contains at ConceptDraw Solution Park a rich set of stencils and professional flowchart symbols for design. It lets create simply professional-looking Flowcharts based on thousand free flowchart templates, colored symbols and examples. ConceptDraw DIAGRAM is a 3 times cheaper alternative to MS Visio available for both Mac and PC. It’s is another full featured business and technical diagramming application that can easily take care of Visio files within OS X. Another bonus with ConceptDraw DIAGRAM – it's cross-platform. You can work on a document in both OS X and Windows, skipping Visio entirely.

