The vector stencils library "Scrum people" contains 30 icons: scrum master, product owner, development team, etc.
Use this clipart set to design your agile software development diagrams and infographics with ConceptDraw PRO software.
"There are three core roles in the scrum framework. These core roles are those committed to the project in the scrum process — they are the ones producing the product (objective of the project). They represent the scrum team. ...
Product owner
The product owner represents the stakeholders and is the voice of the customer, who is accountable for ensuring that the team delivers value to the business. The product owner writes (or has the team write) customer-centric items (typically user stories), ranks and prioritizes them, and adds them to the product backlog. ...
Development team
The development team is responsible for delivering potentially shippable increments (PSIs) of product at the end of each sprint (the sprint goal). A team is made up of 3–9 individuals who do the actual work (analyse, design, develop, test, technical communication, document, etc.). Development teams are cross-functional, with all of the skills as a team necessary to create a product increment. The development team in scrum is self-organizing...
Scrum master
Scrum is facilitated by a scrum master, who is accountable for removing impediments to the ability of the team to deliver the product goals and deliverables. The scrum master is not a traditional team lead or project manager, but acts as a buffer between the team and any distracting influences. The scrum master ensures that the scrum process is used as intended. The scrum master helps ensure the team follows the agreed scrum processes, often facilitates key sessions, and encourages the team to improve." [Scrum (software development). Wikipedia]
The clip art sample "Design elements - Scrum people" is included in the Scrum solution from the Project Management area of ConceptDraw Solution Park.
Used Solutions
Improving Problem Solving and Focus with Fishbone Diagrams
When you need to focus on the problem, professional diagramming tool helps you create a Fishbone diagram also known as Ishikawa diagram. Understanding of the problem via Fishbone diagram will improve the processes between departments and teams. ConceptDraw PRO extended with Fishbone Diagrams solution gives a powerful tool for improving problem solving and focus with Fishbone diagrams.The vector clipart library "Presentation design elements" contains 45 presentation symbols and arrows which you can easy use in your slides and illustrations.
"A presentation is the process of presenting a topic to an audience. It is typically a demonstration, lecture, or speech meant to inform, persuade, or build good will. ... the use of visuals reduced meeting times... audiences believe presenters who use visuals are more professional and credible than presenters who merely speak. ... meetings and presentations reinforced with visuals help participants reach decisions and consensus more quickly." [Presentation. Wikipedia]
The clip art example "Presentation design elements - Vector clipart library" was created in the ConceptDraw PRO diagramming and vector drawing software using the Presentation Clipart solution from the Illustration area of ConceptDraw Solution Park.
Lean Six Sigma Diagram Software
Lean Six Sigma (LSS) is a well-known in all over the world methodology of quality improvement and business perfection. ConceptDraw PRO diagramming and vector drawing software is a powerful Lean Six Sigma Diagram Software thanks to the included Value Stream Mapping solution from the Quality Area of ConceptDraw Solution Park.The vector clipart library "Presentation design elements" contains 45 presentation symbols and arrows which you can easy use in your slides and illustrations.
"A presentation is the process of presenting a topic to an audience. It is typically a demonstration, lecture, or speech meant to inform, persuade, or build good will. ... the use of visuals reduced meeting times... audiences believe presenters who use visuals are more professional and credible than presenters who merely speak. ... meetings and presentations reinforced with visuals help participants reach decisions and consensus more quickly." [Presentation. Wikipedia]
The clip art example "Presentation design elements - Vector clipart library" was created in the ConceptDraw PRO diagramming and vector drawing software using the Presentation Clipart solution from the Illustration area of ConceptDraw Solution Park.
Data Visualization Software Solutions
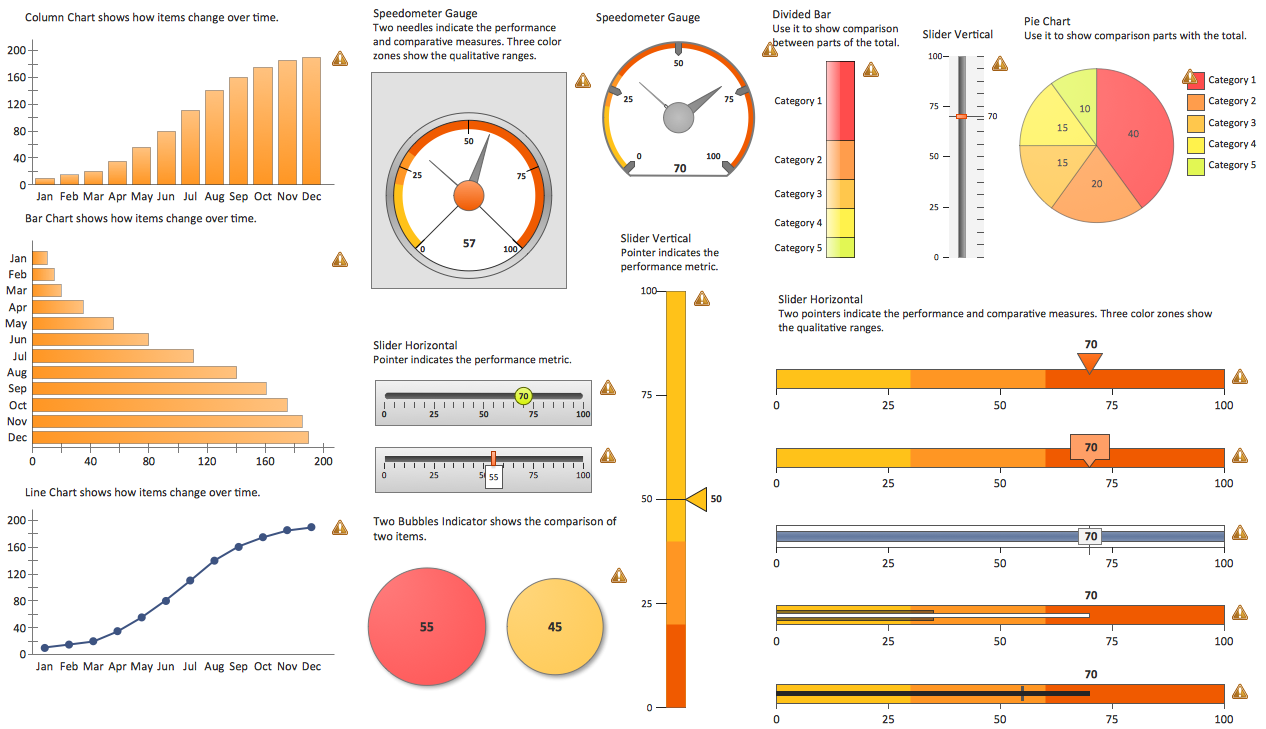
To see how your business can improve you can try data visualization software solutions that allows you visualize all your sales KPI in one sales dashboard allows you monitor and analyse sales activities.Visualizes Vital Data From Sales
The modern way how your business can improve is getting maximum value from sales data you have to analyse and optimize the business. You can visualize vital data from sales using ConceptDraw Sales Dashboard, and then track the data in real time to get clear picture of your business.Agile Methodology
Agile methodology is an excellent alternative to waterfall and traditional sequential development. ConceptDraw PRO software extended with SCRUM Workflow solution is ideal for quick and easy designing various diagrams, charts, mind maps and schematics illustrating software development using Agile methodologies, and in particular Scrum methodology.Fishbone Diagram Problem Solving
The Ishikawa diagram, Cause and Effect diagram, Fishbone diagram — all they are the names of one and the same visual method for working with causal connections. Originally invented by Kaoru Ishikawa to control the process quality, the Ishikawa diagram is well proven in other fields of management and personal scheduling, events planning, time management. It is a chart in the form of a fish, whose head is a problem, the fins are variants for its causes. To design easily the Fishbone diagram, you can use a special ConceptDraw PRO vector graphic and diagramming software which contains the powerful tools for Fishbone diagram problem solving offered by Fishbone Diagrams solution for the Management area of ConceptDraw Solution Park.Work Flow Chart
What is a Work Flow Chart? It is a chart which visually displays the step-by-step transferring of data, documents and tasks during the work. ConceptDraw PRO extended with Workflow Diagrams solution from the Business Processes area of ConceptDraw Solution Park is the best software for drawing the Work Flow Chart of any complexity.How To Create a Workflow Diagram
A workflow diagram is less general notation than a process flow diagram. Workflow as a term can apply to organizational process which involves people, resources, documents, sort of data, for instance; whereas a process is general collection of steps occuring in any sort of activity. That is why process flow diagram can be used as workflow diagram to describe business process, data flow or department interactions. The fastest way to create a workflow diagram is using pre-designed workflow template. ConceptDraw PRO with the Workflow Diagrams solution delivers rich set of workflow diagram templates you may start from.Visualize Sales Data Using Sample Data
ConceptDraw PRO software extended with the Sales Dashboard solution allows you visualize sales data using sample data delivered with the solution to choose visual indicators you need, and then connect these indicators to your real data.Flowchart Example: Flow Chart of Marketing Analysis
An example flowchart of marketing analysis shows main steps you have to challenge writing a marketing analysis.
 Fishbone Diagrams
The Fishbone Diagrams solution extends ConceptDraw PRO v10 software with the ability to easily draw the Fishbone Diagrams (Ishikawa Diagrams) to clearly see the cause and effect analysis and also problem solving. The vector graphic diagrams produced using this solution can be used in whitepapers, presentations, datasheets, posters, and published technical material.
How to Present a Social Media Response Plan DFD to Your Team
Interactive tool helps you find the appropriate response to social media mentions quickly. There are materials to help trainers and consultants develop a social media strategy and provide training for social media groups on how to effectively accomplish their daily work.- Fishbone Diagram Clip Art Gif
- Fishbone Diagram Clip Art
- Cliparts For Fishbone Diagram
- Clip Art Fishbone Diagram
- Free Clipart Impact Analysis
- Design elements - Scrum people | Design elements - Cisco people ...
- Design elements - People | Presentation design elements - Vector ...
- Business Processes | Workflow Diagrams | Tools and Software to ...
- Business People Clipart | People - Vector stencils library | Design ...
- Illustration | Presentation Clipart | Basic Flowchart Symbols and ...
- ConceptDraw Solution Park | Visual Presentations Made Easy with ...
- It Infrastructure Clip Art
- Drawing Illustration | Nature Clipart and Illustrations | Nature ...
- Organizing Management Function Clip Art
- Total Quality Management TQM Diagrams | Acid sulfate soil ...
- Drawing Illustration | Drawing a Nature Scene | Beauty in nature ...
- Winter Sports Vector Clipart . Medal Map. Spatial Infographics ...
- Agile Methodology | Agile Mind Maps: Exploring the User Wishes ...
- Scrum | Scrum Workflow | Scrum workflow | Project Management ...
- Kanban Board Software | Value stream with ConceptDraw PRO ...

