HelpDesk
How to Draw a Pyramid Diagram in ConceptDraw PRO
Pyramid diagram (triangle diagram) is used to represent data, which have hierarchy and basics. Due to the triangular form of diagram, each pyramid section has a different width. The width of the segment shows the level of its hierarchy. Typically, the top of the pyramid is the data that are more important than the base data. Pyramid scheme can be used to show proportional and hierarchical relationships between some logically related items, such as departments within an organization, or successive elements of any process. This type of diagram is often used in marketing to display hierarchical related data, but it can be used in a variety of situations. ConceptDraw PRO allows you to make a pyramid diagram, quickly and easily using special libraries.HelpDesk
Accounting Information Systems Flowchart Symbols
Accounting Information system is a combination of software and hardware, as well as organizational support. Information system - it is not only the software and computers with network equipment, but also a list of instructions and standards which can be notated using Accounting information systems flowchart symbols. All information systems can be divided into information retrieval and data processing systems. Data Flow model is a hierarchical model. Each process can be divided into structural components, that depict by corresponding flowchart symbols, showing the accounting information system in communication with the external environment. The major components of accounting information systems flowchart are: entities, processes, data stores, and data flows. The set of standard accounting information flowchart symbols is intended to show the relationships between the system components. ConceptDraw PRO can help to draw clear accounting information system diagrams using special flowchart symbols.Data structure diagram with ConceptDraw PRO
Data structure diagram (DSD) is intended for description of conceptual models of data (concepts and connections between them) in the graphic format for more obviousness. Data structure diagram includes entities description, connections between them and obligatory conditions and requirements which connect them. Create Data structure diagram with ConceptDraw PRO.Bio Flowchart Lite
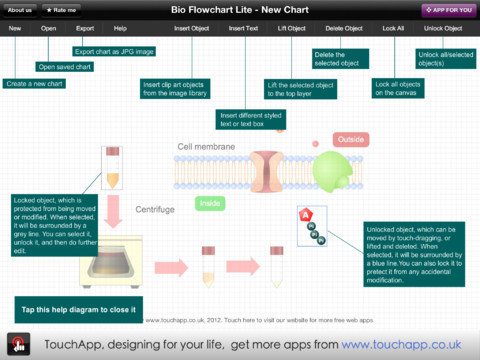
This app targets to help teachers and students to create vivid and professional biological flowcharts and diagrams in an easy way.- Organizational Structure | Active Directory Domain Services diagram ...
- Hierarchy Flowchart Template Best
- Process Flowchart | How to Draw an Organization Chart | Data ...
- 4 Level pyramid model diagram - Information systems types ...
- Pyramid Diagram | Pyramid Diagram | Process Flowchart | Chart Of ...
- Organizational Structure | Process Flowchart | Pyramid Diagram ...
- Draw A Diagram For Data Hierarchy
- Process Flowchart | Organizational Structure | Process Flow Chart ...
- Hierarchy Flowchart Template Download
- How to Create Flowcharts for an Accounting Information System ...
- Process Flowchart | Organizational Structure | How to Draw an ...
- Organizational Structure | Active Directory Diagram | Tree Network ...
- Process Flowchart | Data Flow Diagrams (DFD) | Pyramid Diagram ...
- Pyramid Diagram | Organizational Structure Types | Basic Flowchart ...
- Process Flowchart | How to Draw an Organization Chart ...
- Organizational Structure | Process Flowchart | Basic Flowchart ...
- Organizational Structure | Basic Flowchart Symbols and Meaning ...
- Process Flowchart | Organizational Structure | How to Draw an ...
- Pyramid Diagram | Process Flowchart | Pyramid Charts | Sales ...
- Process Flowchart | Organizational Charts with ConceptDraw PRO ...


