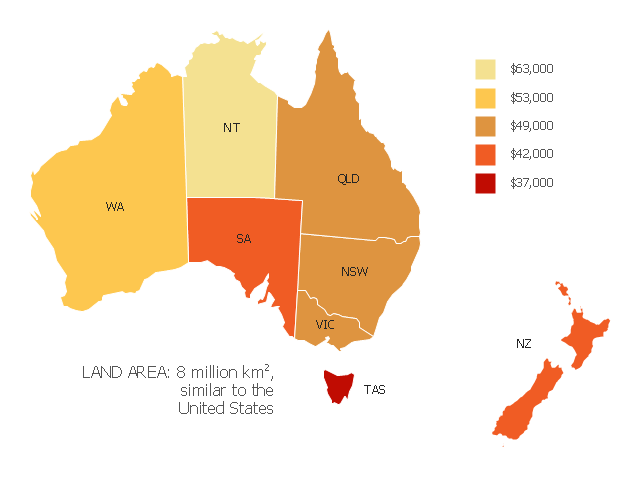
"Household income is a measure of the combined incomes of all people sharing a particular household or place of residence. It includes every form of income, e.g., salaries and wages, retirement income, near cash government transfers like food stamps, and investment gains.
Average household income can be used as an indicator for the monetary well-being of a country's citizens. Mean or median net household income, after taxes and mandatory contributions, are good indicators of standard of living, because they include only disposable income and acknowledge people sharing accommodation benefit from pooling at least some of their living costs.
Average household incomes need not map directly to measures of an individual's earnings such as per capita income as numbers of people sharing households and numbers of income earners per household can vary significantly between regions and over time." [Household income. Wikipedia]
This map example shows 2007 median household incomes in the states and mainland territories of the Commonwealth of Australia.
The thematic map example "Map of median household income in Australia" was redesigned from the Wikimedia Commons file: Map of median household income in Australia.PNG.
[commons.wikimedia.org/ wiki/ File:Map_ of_ median_ household_ income_ in_ Australia.PNG]
The example "Map of median household income in Australia" was created using the ConceptDraw PRO diagramming and vector drawing software extended with the Continent Map solution from the Maps area of ConceptDraw Solution Park.
Thematic map - Australia
Line Graph Charting Software

Chart Examples

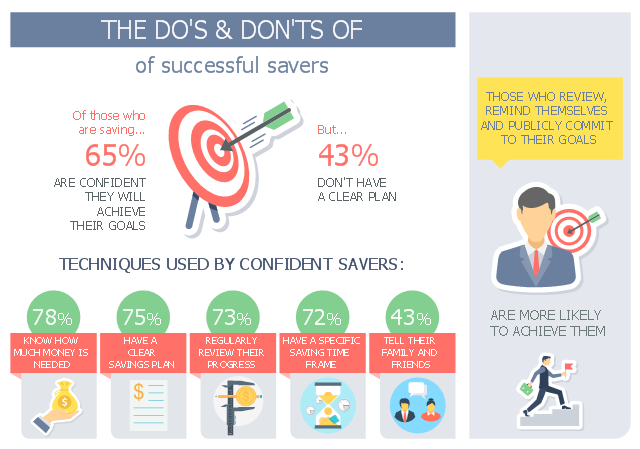
This business infographic sample shows how Australians save money, people's different saving styles as well as the techniques used by successful savers. It was designed on the base of the infographic "How Australians save money" from the MoneySmart website of the Australian Securities and Investments Commission (ASIC).
[moneysmart.gov.au/ managing-your-money/ saving/ how-australians-save-money]
"Saving is income not spent, or deferred consumption. Methods of saving include putting money aside in, for example, a deposit account, a pension account, an investment fund, or as cash. Saving also involves reducing expenditures, such as recurring costs. In terms of personal finance, saving generally specifies low-risk preservation of money, as in a deposit account, versus investment, wherein risk is higher; in economics more broadly, it refers to any income not used for immediate consumption." [Saving. Wikipedia]
The business infographic example "Do's and Don'ts of successful savers" was designed using ConceptDraw PRO diagramming and vector drawing software extended with the Business and Finance solution from Illustration area of ConceptDraw Solution Park.
Infographic
Geo Map — Europe — Poland

 Pie Charts
Pie Charts are extensively used in statistics and business for explaining data and work results, in mass media for comparison (i.e. to visualize the percentage for the parts of one total), and in many other fields. The Pie Charts solution for ConceptDraw DIAGRAM offers powerful drawing tools, varied templates, samples, and a library of vector stencils for simple construction and design of Pie Charts, Donut Chart, and Pie Graph Worksheets.
Chart Templates

Scatter Graph Charting Software

Social Media Flowchart Symbols

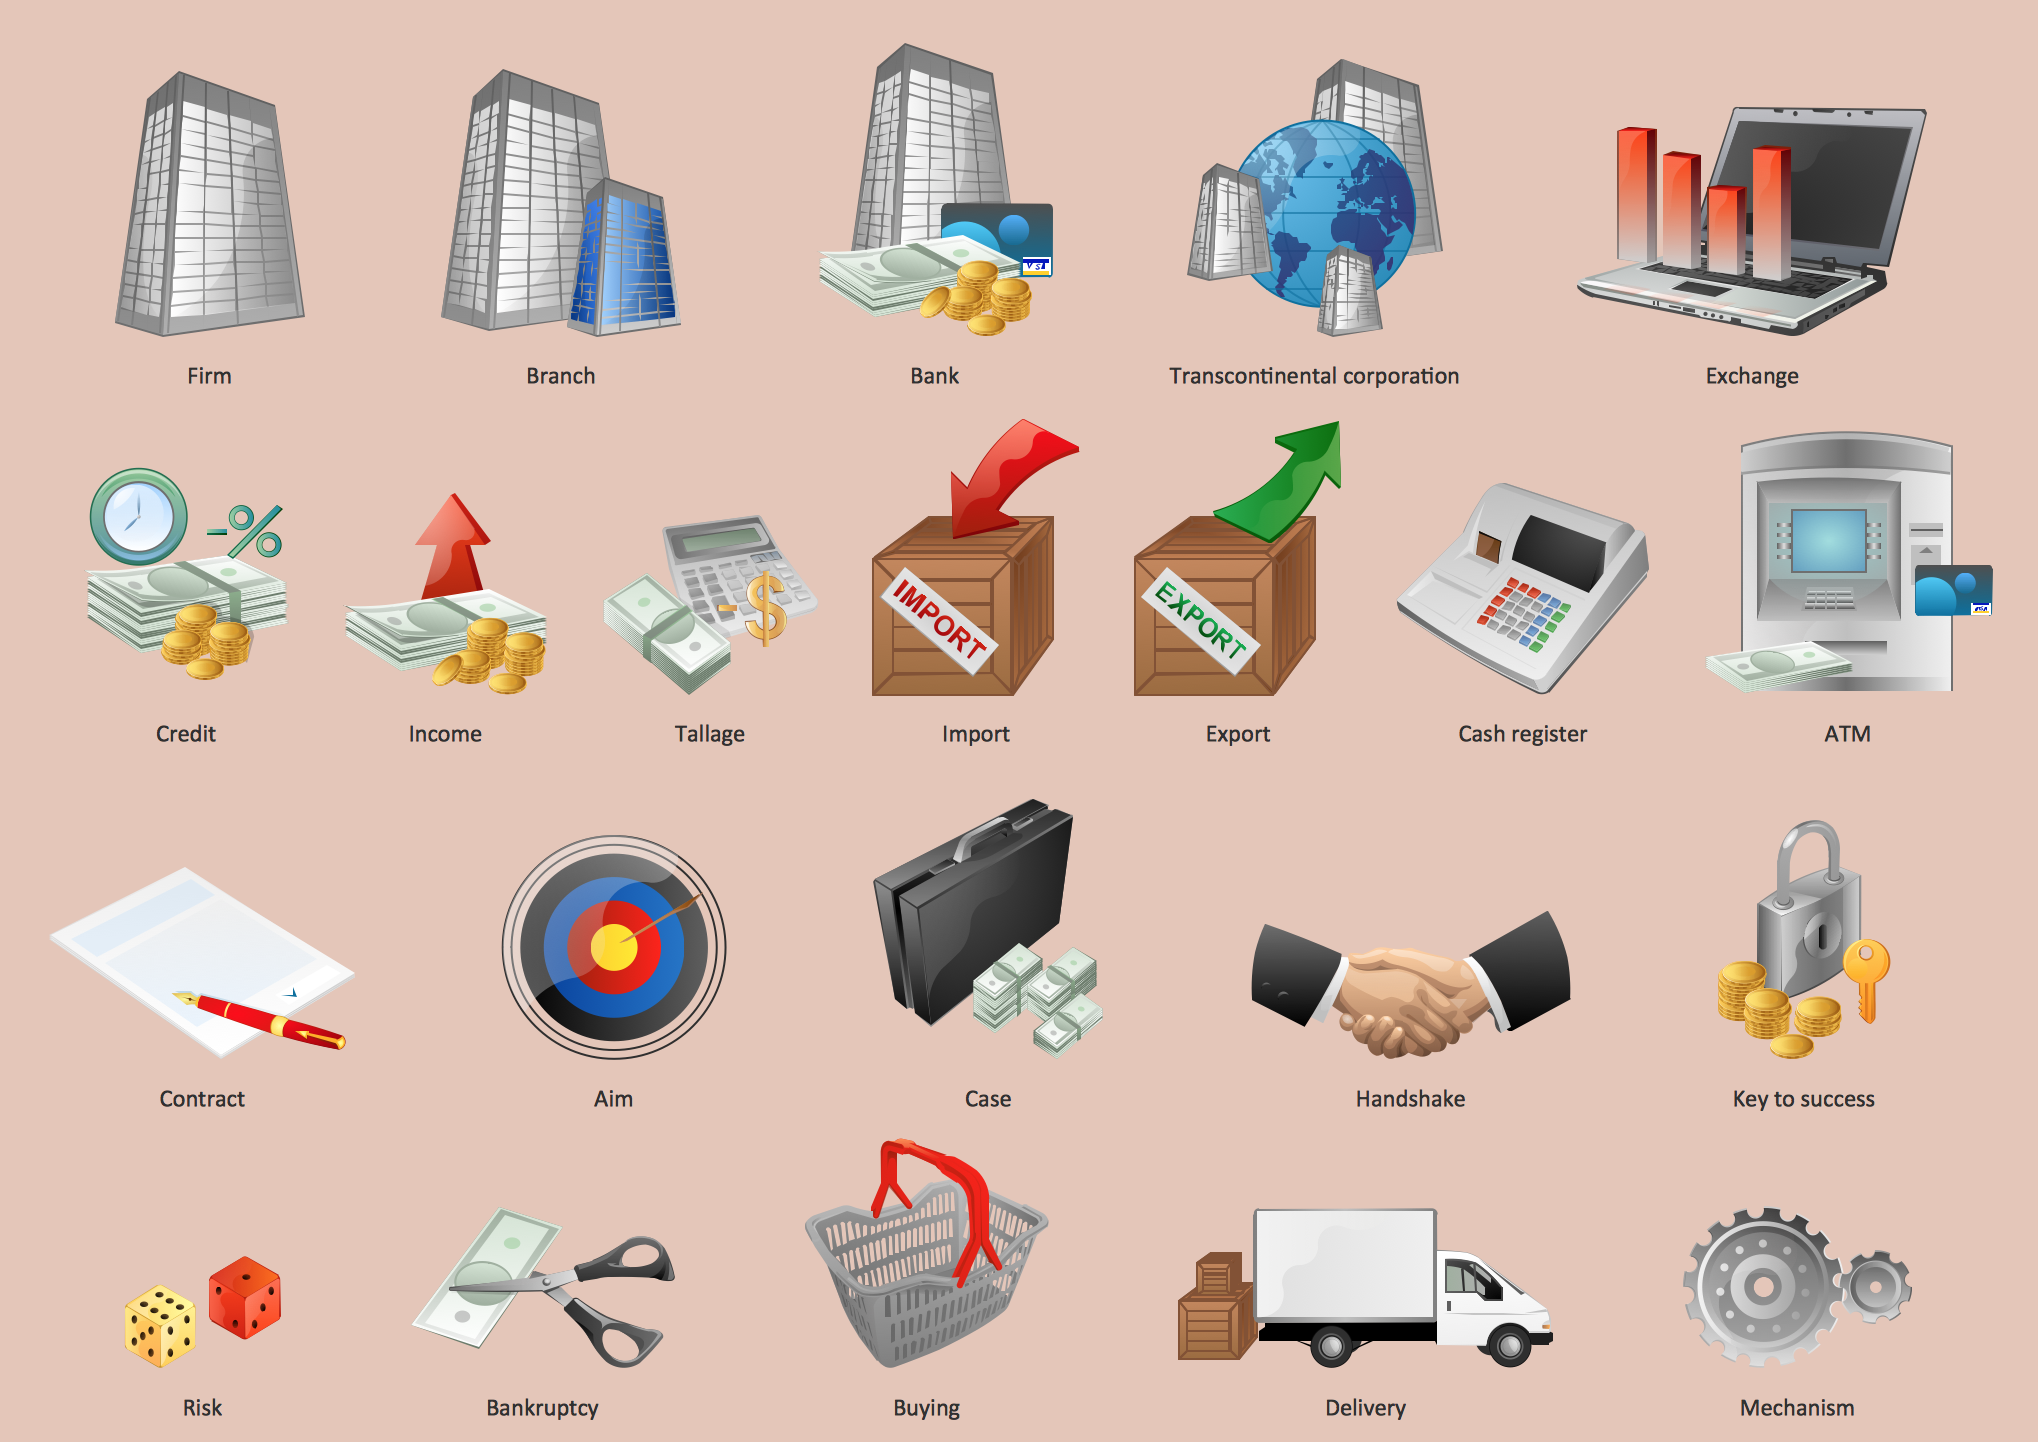
Business - Design Elements
Functional Flow Block Diagram

Scatter Chart Examples

Geo Map — USA — Virginia

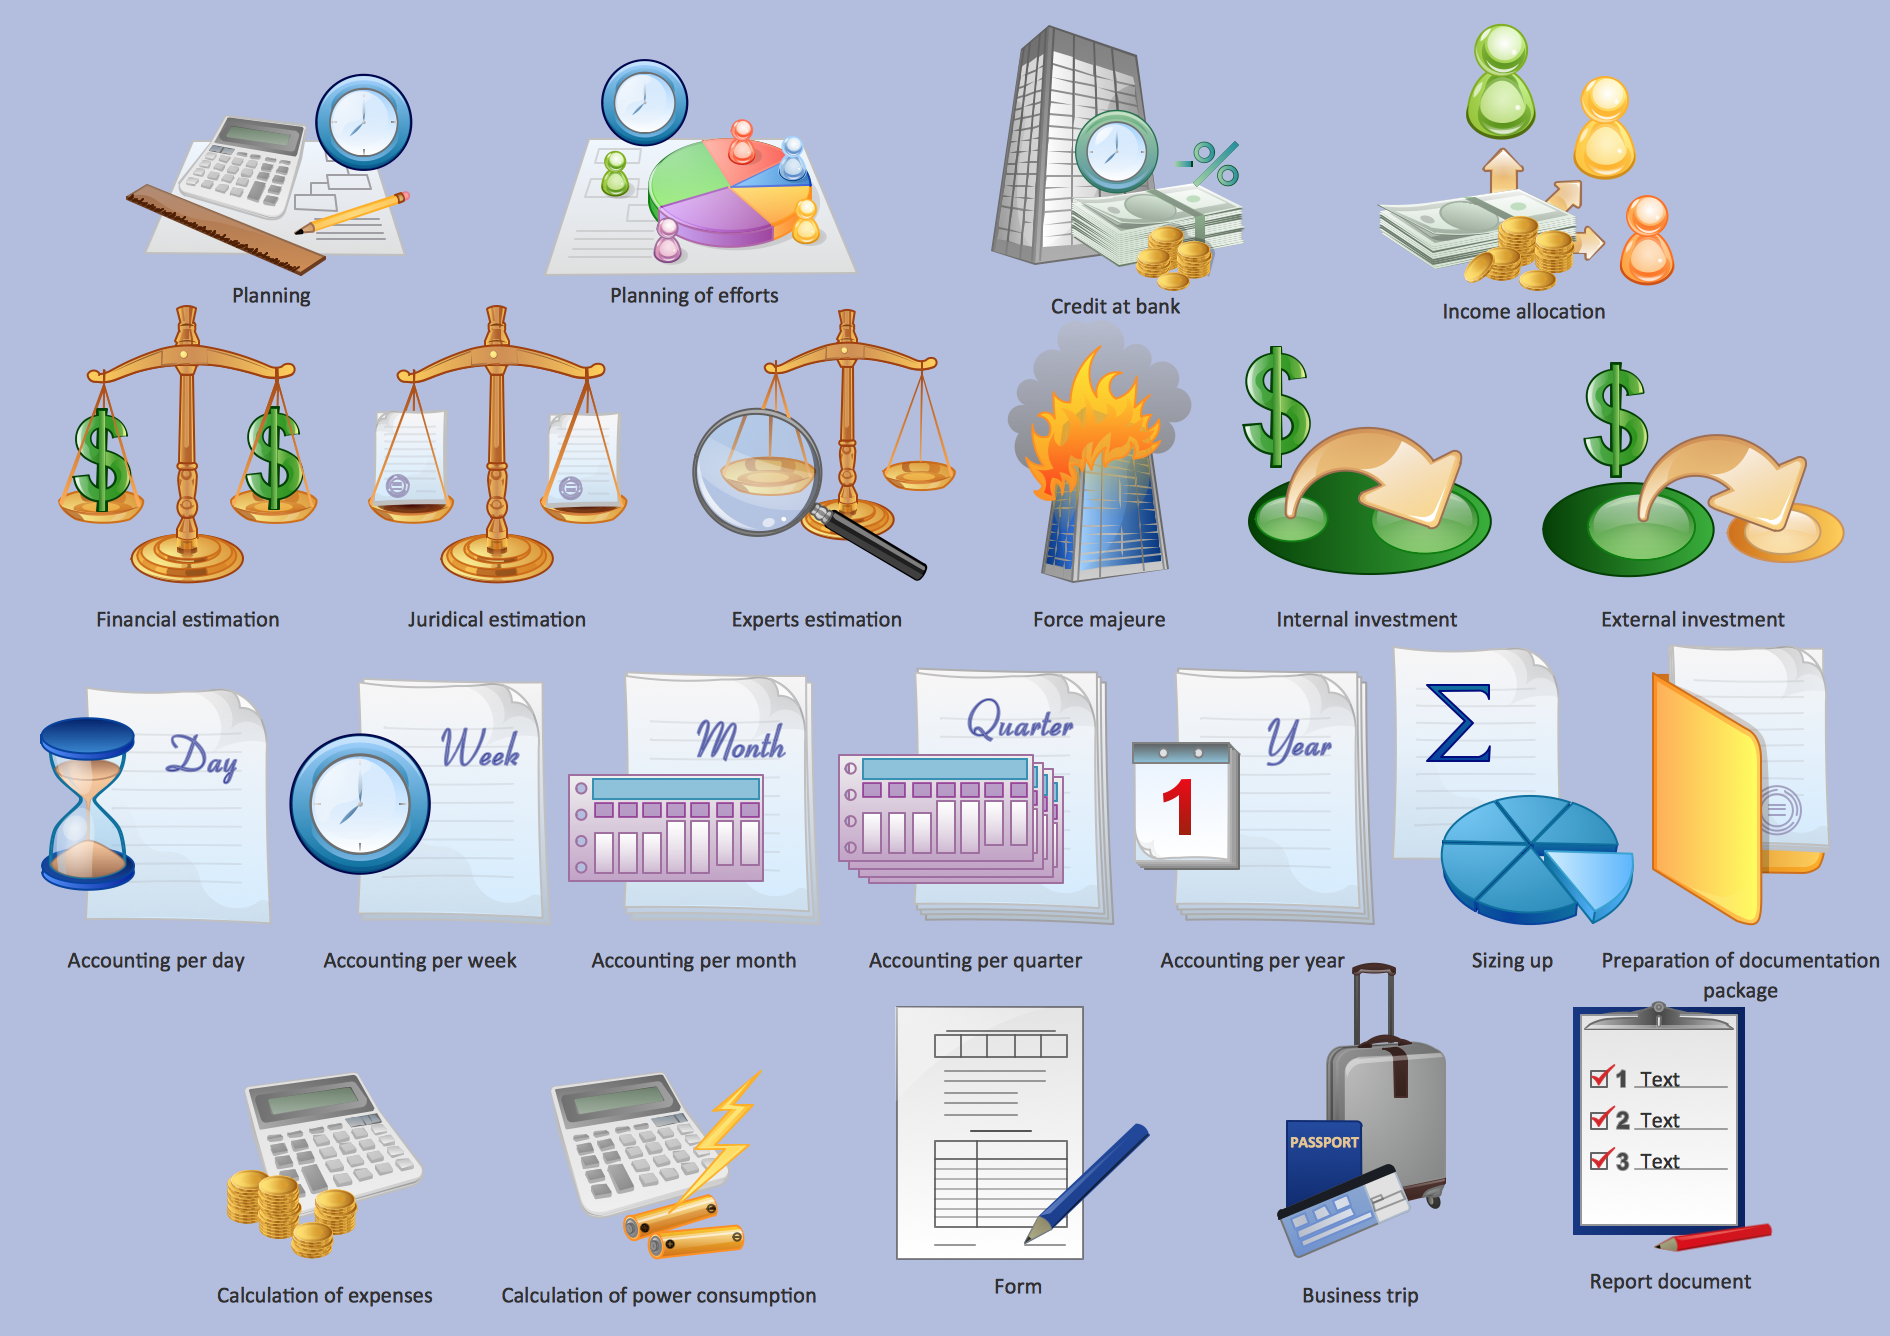
Management - Design Elements
Restaurant Floor Plans

- Pyramid Diagram | Time , quality, money triangle diagram | Pyramid ...
- Geo Map - Australia | Map of median household income in Australia ...
- Nz Map Png
- Geo Map - Australia | Geo Map - Asia - Papua New Guinea | Map of ...
- Geo Map - Australia | Map of median household income in Australia ...
- Map of median household income in Australia | Map of median ...
- Investment Png
- Map of median household income in Australia | Continent Maps ...
- Indicator Png
- Cash Png
- Png Indicator
- Accounting Flowchart Symbols | Bar Chart Software | Timeline ...
- Taxes Png
- Australia states time zones - Thematic map | Design elements ...
- Map of median household income in Australia | Shares of aggregate ...
- Australiamap Png
- Pyramid Diagram | Time , quality, money triangle diagram | Currency ...
- Australia states time zones - Thematic map | Australia map ...
- Geo Map - United States of America Map | Australia states time ...
- Australia Map Example