Accounting Data Flow from the Accounting Flowcharts Solution
Accounting Data Flow from the Accounting Flowcharts Solution visually describes the financial accounting process, shows the accumulated information about transactions and events for creating the balance sheet and the final income statement. Accounting Flowcharts Solution contains also a wide variety of templates and samples that you can use as the base for your own Accounting Flowcharts of any complexity.Business - Design Elements
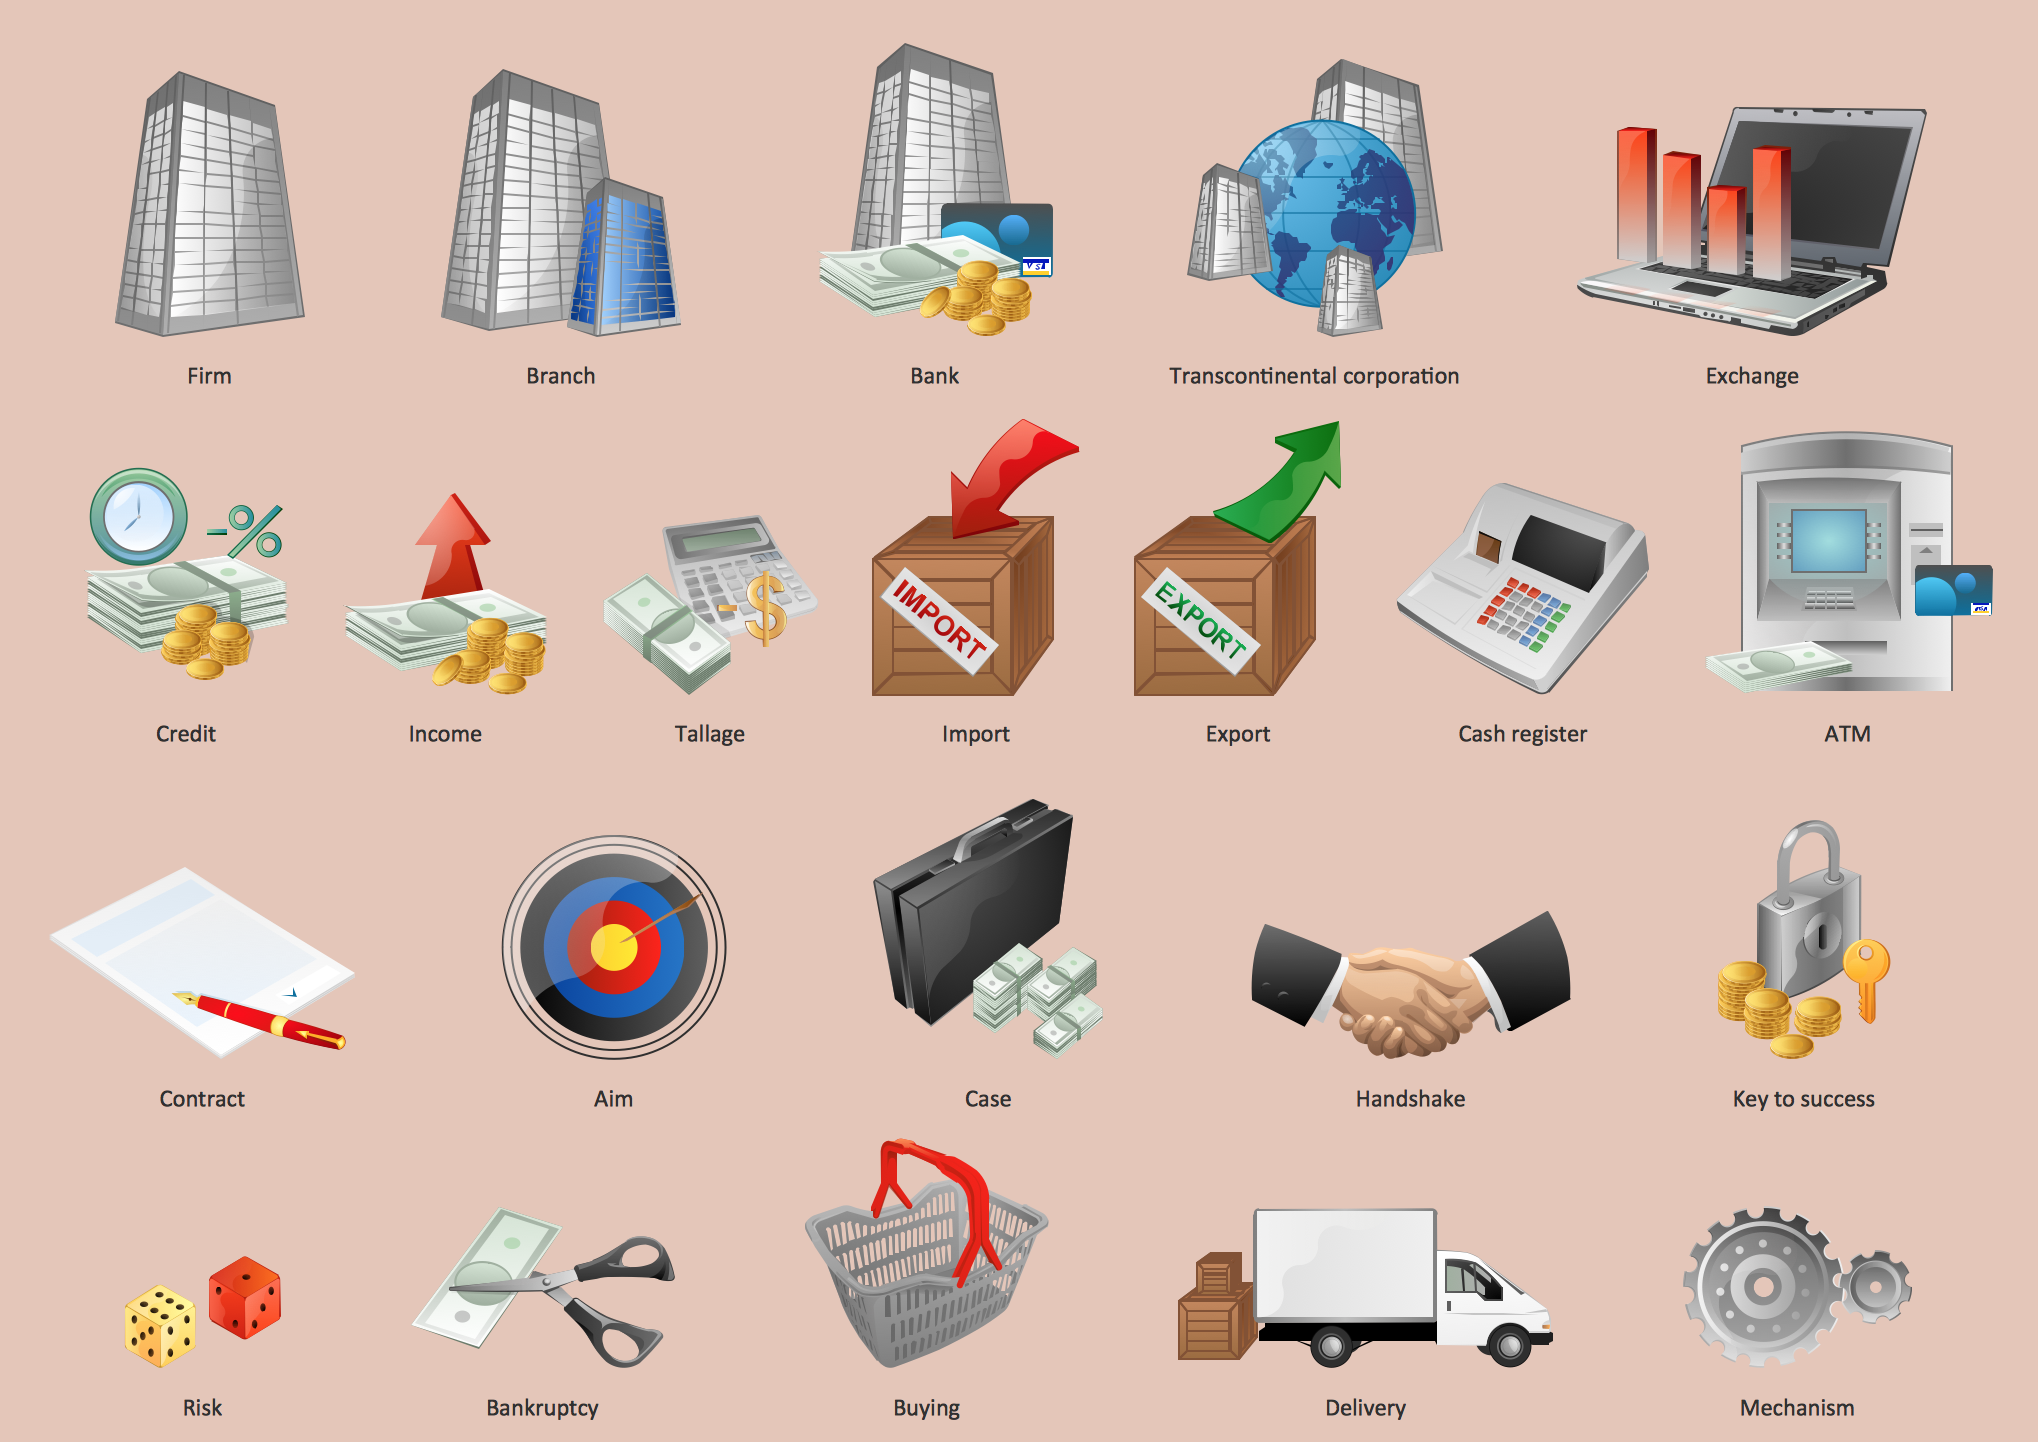
Choose which of business design elements you love best. Design your own style with Business and Finance Solutions from ConceptDraw DIAGRAM. We created a full set of elements, business samples, templates and libraries with vector clip art for drawing the Business Illustrations. Mark your report or presentation, pay an attention of audience on your drawings with vector business design elements.Account Flowchart Stockbridge System. Flowchart Examples
Create your own flow charts of data processing systems using the ConceptDraw DIAGRAM diagramming and vector drawing software extended with the Cross-Functional Flowcharts solution from the Business Processes area of ConceptDraw Solution Park. This is a flowchart of a data processing system combining manual and computerized processing to handle accounts receivable, billing, and general ledger.Scatter Chart Examples
The Line Graphs solution from Graphs and Charts area of ConceptDraw Solution Park contains a set of examples, templates and design elements library of scatter charts. Use it to draw scatter graphs using ConceptDraw DIAGRAM diagramming and vector drawing software for illustrating your documents, presentations and websites.Geo Map - Africa - Benin
Benin, officially the Republic of Benin, is a country in West Africa. It is bordered by Togo to the west, by Nigeria to the east and by Burkina Faso and Niger to the north. The vector stencils library Benin contains contours for ConceptDraw DIAGRAM diagramming and vector drawing software. This library is contained in the Continent Maps solution from Maps area of ConceptDraw Solution Park.Swot Analysis Examples
SWOT analysis is an advanced plan making methodology for detection the Strengths and Weaknesses, Opportunities and Threats, that are involved in a project. SWOT analysis possesses a wide variety of real and potential applications and is a key part of any business planning and analysis. SWOT analysis uses as a visual tool the SWOT diagrams and SWOT matrices. ConceptDraw DIAGRAM software with SWOT and TOWS Matrix Diagrams solution provides a lot of SWOT analysis examples and samples, and also numerous collection of built-in SWOT templates, which will be the good start in your self-depending drawing and the perfect source of inspiration. You can always start to design your SWOT diagrams from the blank sheet using the included predesigned vector objects, but in many cases to save the time and efforts for SWOT diagramming would be preferable to use the ready example the most appropriate to your needs. Customizing the proposed SWOT diagrams you will achieve a great success in drawing SWOT matrices of any style and complexity.Chart Examples
Easy charting software comes with beautiful chart templates and examples. This makes it easy to create professional charts without prior experience.Scatter Graph Charting Software
ConceptDraw provides some interactive xy chart and scatter graph symbols that offers advanced features yet is simple to use.Geo Map - Asia - Saudi Arabia
First of all, Saudi Arabia is known as "the Land of the Two Holy Mosques". Two of the holiest sites of Islam are located in Saudi Arabia. Medina - the city where the Quran was finally approved, and where Prophet Muhammad was buried, and Mecca, the birthplace of Muhammad. Every year, millions of muslims perform hajj and visit Al-Masjid al-Haram - the Sacred Mosque. Unfortunately, the entry is prohibited for non-Muslim people. The citizens of the country live under Sharia law, which impose certain obligations. For example, the usage of drugs and alcohol is forbidden. Gambling is also under the ban. Expats have a possibility to live in special reservations - compounds, where some concessions are allowed, for example, the appearance of women is not so strictly regulated and they have a right to drive there.Lean Six Sigma Diagram Software
Lean Six Sigma (LSS) is a well-known in all over the world methodology of quality improvement and business perfection. ConceptDraw DIAGRAM diagramming and vector drawing software is a powerful Lean Six Sigma Diagram Software thanks to the included Value Stream Mapping solution from the Quality Management Area of ConceptDraw Solution Park.Blank Scatter Plot
This sample shows the Scatter Plot without missing categories. It’s very important to no miss the data, because this can have the grave negative consequences. The data on the Scatter Chart are represented as points with two values of variables in the Cartesian coordinates. This sample can be used in the engineering, business, statistics, analytics, at the creating the financial and other types of reports.Chart Templates
Easy charting software comes with beautiful chart templates and examples. This makes it easy to create professional charts without prior experience.
 Bar Graphs
The Bar Graphs solution enhances ConceptDraw DIAGRAM functionality with templates, numerous professional-looking samples, and a library of vector stencils for drawing different types of Bar Graphs, such as Simple Bar Graph, Double Bar Graph, Divided Bar Graph, Horizontal Bar Graph, Vertical Bar Graph, and Column Bar Chart.
Restaurant Floor Plans
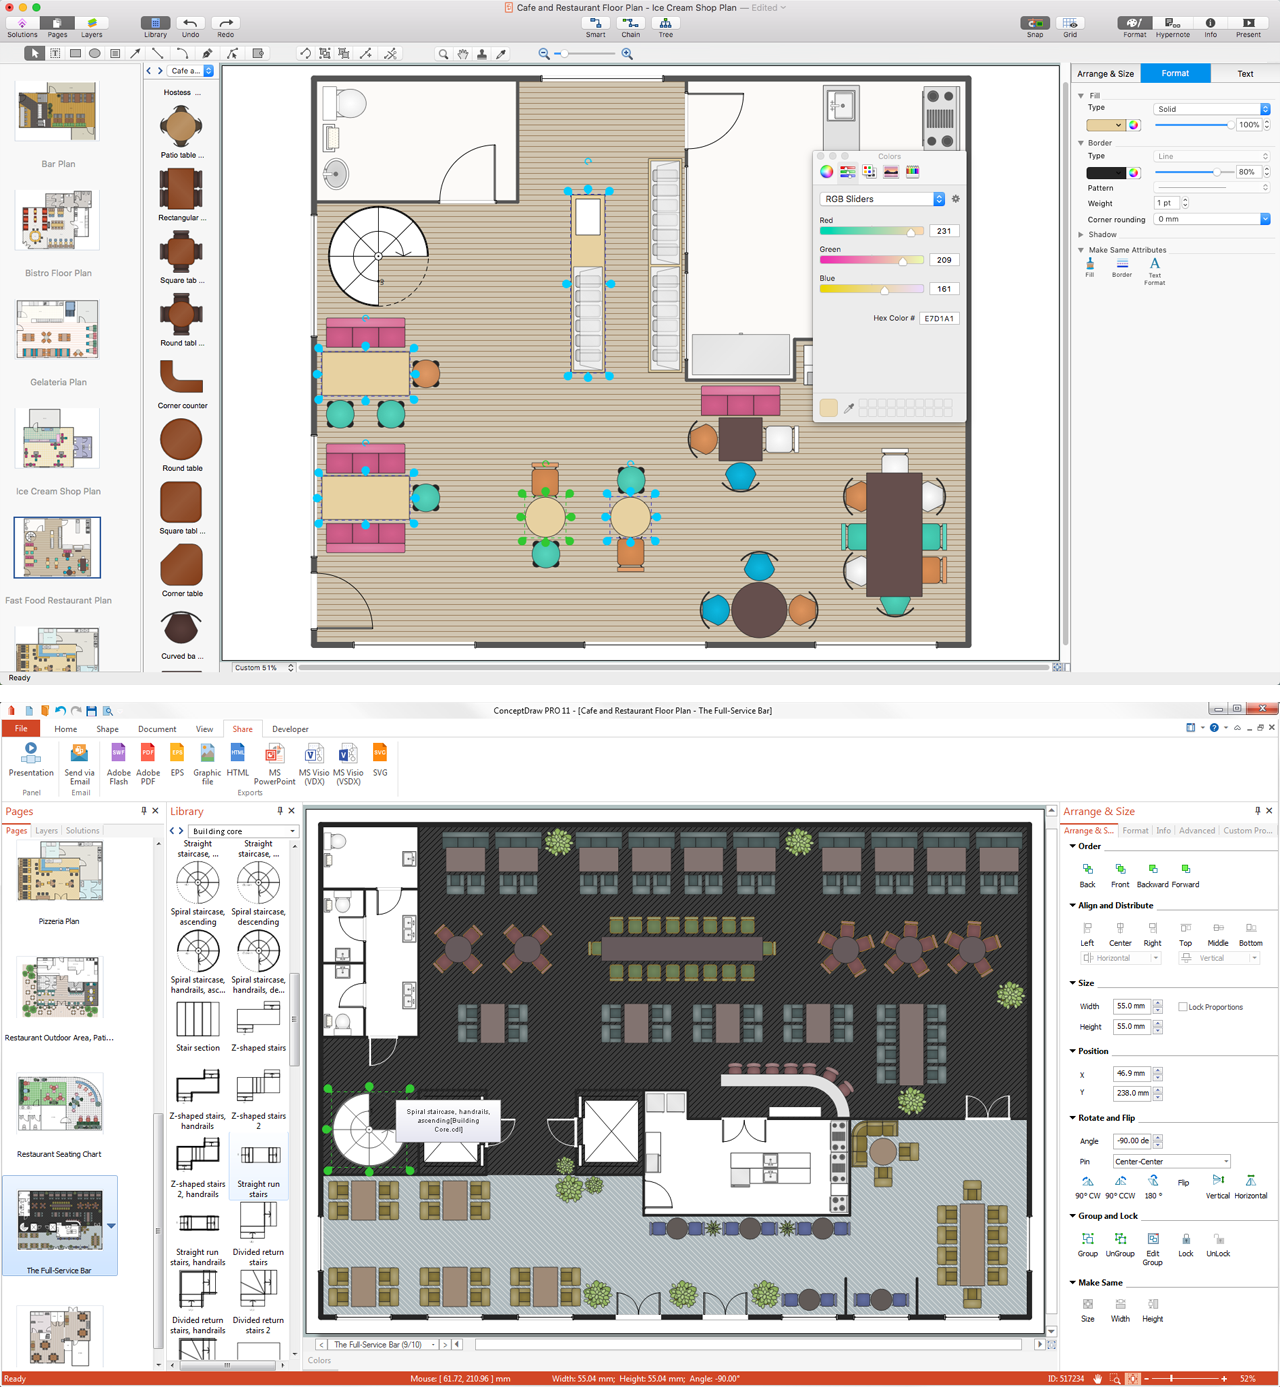
The restaurant business is considered as one of the most attractive types of investments. This service is characterized by a high level of competition, but at the same time it will be always in demand, the main thing is correctly approach to the question of organization. The making of business plan of the restaurant, cafe or bar with detailed calculations will help to organize effectively this type of activity, to define the goals, to think over the main concept, and to realize the careful planning. The business owner can make its own business plan for the restaurant from the beginning or to find the ready plan and to make the similar or to adjust it in accordance with its specific conditions, requirements and desires. ConceptDraw DIAGRAM software and Cafe and Restaurant Plans solution from the ConceptDraw Solution Park provide a lot of samples, templates and vector stencils libraries with ready-made design elements for effective and professional cafe, bar, and restaurant design and restaurant floor plan construction. Use them to achieve a success in restaurant business.
 Pie Charts
Pie Charts are extensively used in statistics and business for explaining data and work results, in mass media for comparison (i.e. to visualize the percentage for the parts of one total), and in many other fields. The Pie Charts solution for ConceptDraw DIAGRAM offers powerful drawing tools, varied templates, samples, and a library of vector stencils for simple construction and design of Pie Charts, Donut Chart, and Pie Graph Worksheets.
- Fruit Art | Pictures of Vegetables | Food Art | What Are The Example ...
- Bar Graphs | Sales Growth. Bar Graphs Example | Picture Graphs ...
- Fruit Art | Pictures of Vegetables | Relative price changes for fresh ...
- Pictures of Vegetables | Relative price changes for fresh fruits and ...
- Dfd For Image Processing Project
- UK internet use by people | Export from ConceptDraw PRO ...
- Population growth by continent | Picture Graph | Pictures of Graphs ...
- Bar Graphs | Line Graphs | How to Draw a Line Graph | Graph
- Relative price changes for fresh fruits and vegetables, sugars ...
- Chart Maker for Presentations | Chart Software for Better ...
- Fruit Art | Relative price changes for fresh fruits and vegetables ...
- Hd Image Of Curve Design Png
- Workflow Diagram | Why Flowchart Important to Accounting ...
- Frequency Distribution Dashboard | Flow chart Example ...
- Accounting Vector Image
- Accounting Sign Vector Images
- Basic Flowchart Symbols and Meaning | Audit Flowchart Symbols ...
- Picture Graph | How to Draw a Line Graph | Continent Maps | How ...
- Ribbon interface - Vector stencils library | Time scales - Education ...
- Income Tax Logo Icons Diagrams


