"Household income is a measure of the combined incomes of all people sharing a particular household or place of residence. It includes every form of income, e.g., salaries and wages, retirement income, near cash government transfers like food stamps, and investment gains.
Average household income can be used as an indicator for the monetary well-being of a country's citizens. Mean or median net household income, after taxes and mandatory contributions, are good indicators of standard of living, because they include only disposable income and acknowledge people sharing accommodation benefit from pooling at least some of their living costs.
Average household incomes need not map directly to measures of an individual's earnings such as per capita income as numbers of people sharing households and numbers of income earners per household can vary significantly between regions and over time." [Household income. Wikipedia]
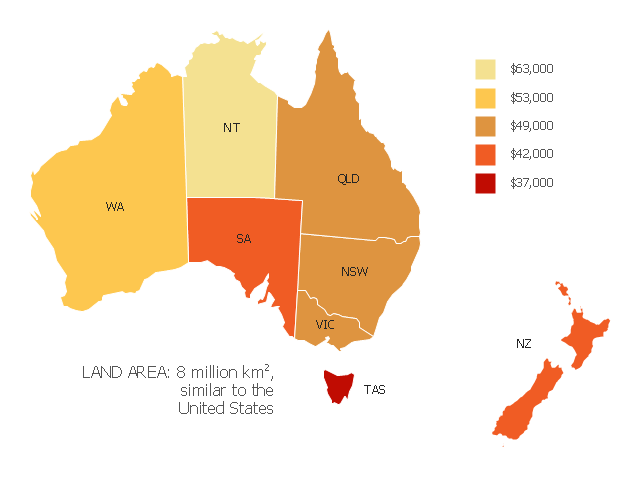
This map example shows 2007 median household incomes in the states and mainland territories of the Commonwealth of Australia.
The thematic map example "Map of median household income in Australia" was redesigned from the Wikimedia Commons file: Map of median household income in Australia.PNG.
[commons.wikimedia.org/ wiki/ File:Map_ of_ median_ household_ income_ in_ Australia.PNG]
The example "Map of median household income in Australia" was created using the ConceptDraw PRO diagramming and vector drawing software extended with the Continent Map solution from the Maps area of ConceptDraw Solution Park.
Average household income can be used as an indicator for the monetary well-being of a country's citizens. Mean or median net household income, after taxes and mandatory contributions, are good indicators of standard of living, because they include only disposable income and acknowledge people sharing accommodation benefit from pooling at least some of their living costs.
Average household incomes need not map directly to measures of an individual's earnings such as per capita income as numbers of people sharing households and numbers of income earners per household can vary significantly between regions and over time." [Household income. Wikipedia]
This map example shows 2007 median household incomes in the states and mainland territories of the Commonwealth of Australia.
The thematic map example "Map of median household income in Australia" was redesigned from the Wikimedia Commons file: Map of median household income in Australia.PNG.
[commons.wikimedia.org/ wiki/ File:Map_ of_ median_ household_ income_ in_ Australia.PNG]
The example "Map of median household income in Australia" was created using the ConceptDraw PRO diagramming and vector drawing software extended with the Continent Map solution from the Maps area of ConceptDraw Solution Park.
Thematic map - Australia
 Continent Maps
Continent Maps solution extends ConceptDraw PRO software with templates, samples and libraries of vector stencils for drawing the thematic maps of continents, state maps of USA and Australia.
Geo Map - Africa - Benin

Geo Map - USA - New Jersey

Geo Map - Asia - Saudi Arabia

 Bar Graphs
The Bar Graphs solution enhances ConceptDraw PRO v10 functionality with templates, numerous professional-looking samples, and a library of vector stencils for drawing different types of Bar Graphs, such as Simple Bar Graph, Double Bar Graph, Divided Bar Graph, Horizontal Bar Graph, Vertical Bar Graph, and Column Bar Chart.
 Basic Scatter Diagrams
This solution extends ConceptDraw PRO v10.3.0 (or later) with templates, samples and a library of vector stencils for drawing Scatter Diagrams.
 Divided Bar Diagrams
The Divided Bar Diagrams Solution extends the capabilities of ConceptDraw PRO v10 with templates, samples, and a library of vector stencils for drawing high impact and professional Divided Bar Diagrams and Graphs, Bar Diagram Math, and Stacked Graph.
 Business Intelligence Dashboard
Business Intelligence Dashboard solution extends the ConceptDraw PRO v11 functionality with exclusive tools, numerous ready-to-use vector objects, samples and quick-start templates for creation professional Business Intelligence Dashboards, Business Intelligence Graphics, Business Intelligence Charts and Maps of different kinds. Design easy the BI dashboard, BI model or Dynamic chart in ConceptDraw PRO to monitor the company's work, to track the indicators corresponding your company's data, to display and analyze key performance indicators, to evaluate the trends and regularities of the processes occurring at the company.
 Pie Charts
Pie Charts are extensively used in statistics and business for explaining data and work results, in mass media for comparison (i.e. to visualize the percentage for the parts of one total), and in many other fields. The Pie Charts solution for ConceptDraw PRO v10 offers powerful drawing tools, varied templates, samples, and a library of vector stencils for simple construction and design of Pie Charts, Donut Chart, and Pie Graph Worksheets.
 Social Media Response
This solution extends ConceptDraw PRO and ConceptDraw MINDMAP with the ability to draw interactive flow charts with action mind map templates, to help create an effective response to applicable social media mentions.
 Business Productivity Area
Business Productivity Solutions extend ConceptDraw products with tools for making presentations, conducting meetings, preparing documents, brainstorming, or building new strategies.
 Circle-Spoke Diagrams
Examples of subject areas that are well suited to this approach are marketing, business, products promotion, process modeling, market, resource, time, and cost analysis. Circle-Spoke Diagrams are successfully used in presentations, conferences, management documents, magazines, reportages, reviews, reports, TV, and social media.
 Timeline Diagrams
Timeline Diagrams solution extends ConceptDraw PRO software with templates, samples and library of vector stencils for drawing the timeline and milestones diagrams.
- Map of median household income in Australia | Map of median ...
- Map of median household income in Australia | Continent Maps ...
- Geo Map - Australia | Map of median household income in Australia ...
- Map of median household income in Australia
- Geo Map - Australia | Geo Map - Asia - Papua New Guinea | Geo ...
- Map of median household income in Australia | Shares of aggregate ...
- Australia Map Example
- Map of median household income in Australia | Cause and effect ...
- Pyramid Diagram | UML Activity Diagram | Map of median ...
- Geo Map - Australia - New Zealand
- Map Of Australia Png
- Geo Map - Asia - Papua New Guinea | Geo Map - Australia | Map of ...
- Bipolar current mirror - Circuit diagram | Map of median household ...
- Australia states time zones - Thematic map | Design elements ...
- Geo Map - Australia - New Zealand
- Australia states time zones - Thematic map
- Middle East - Political map | Southwest Asia - Political map | Map of ...
- Bar Graphs | Average Household Income Usa
- Languages of South America - Thematic map | Benefit Corporation ...
- Bar Diagrams for Problem Solving. Create economics and financial ...