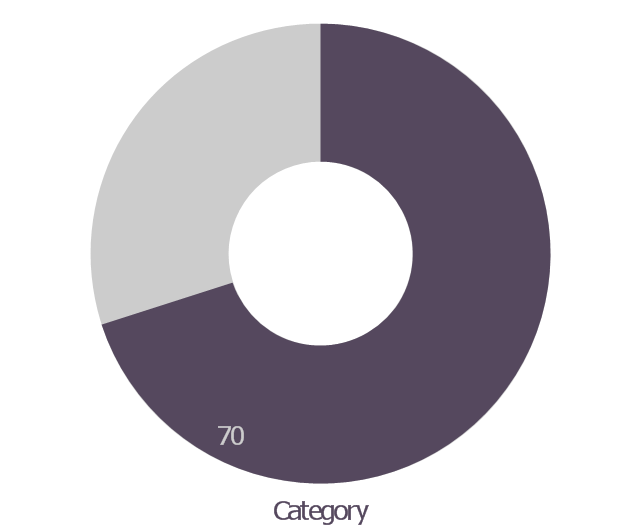
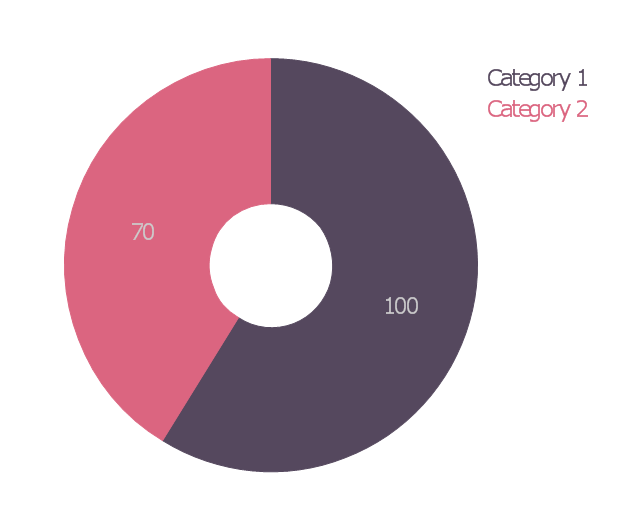
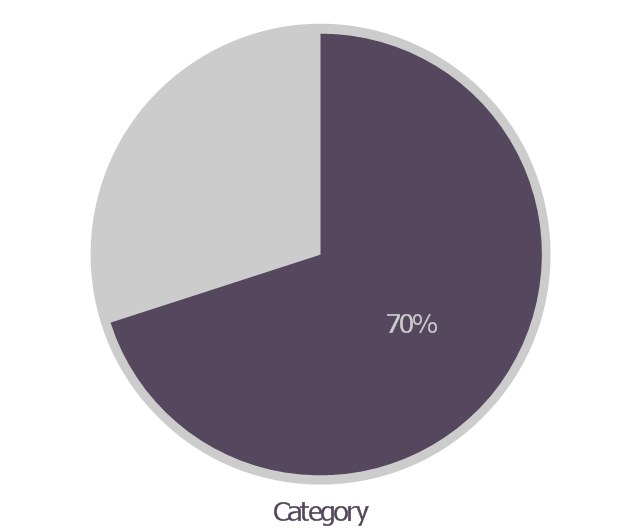
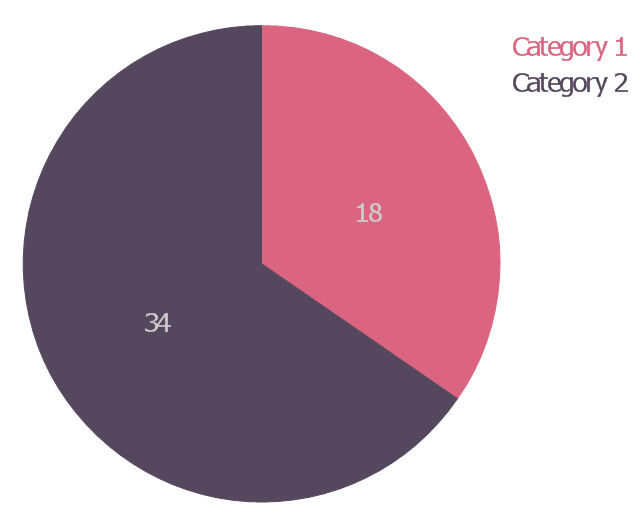
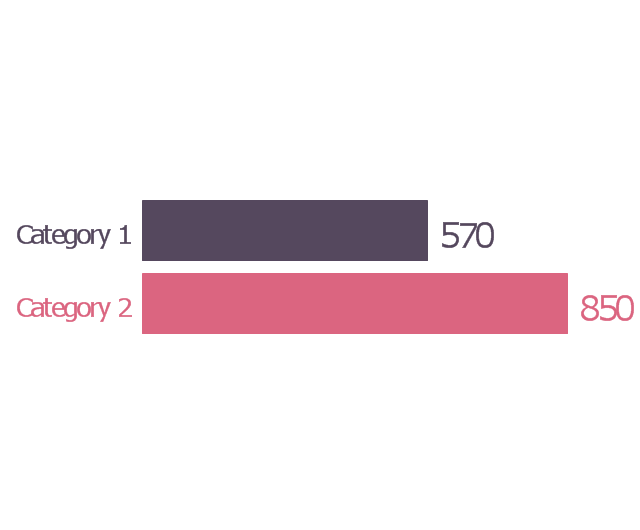
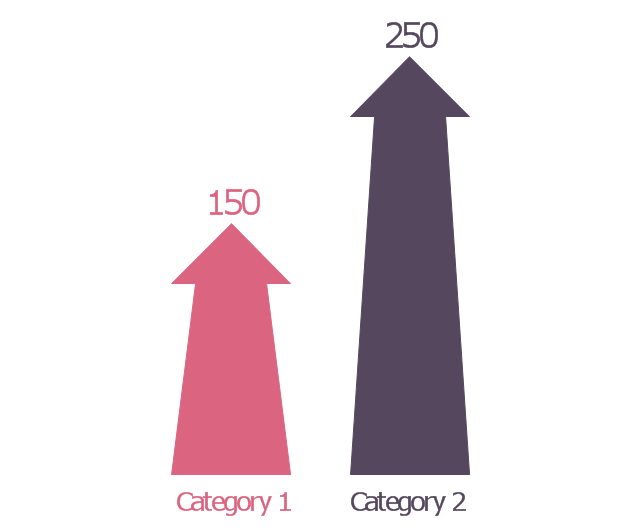
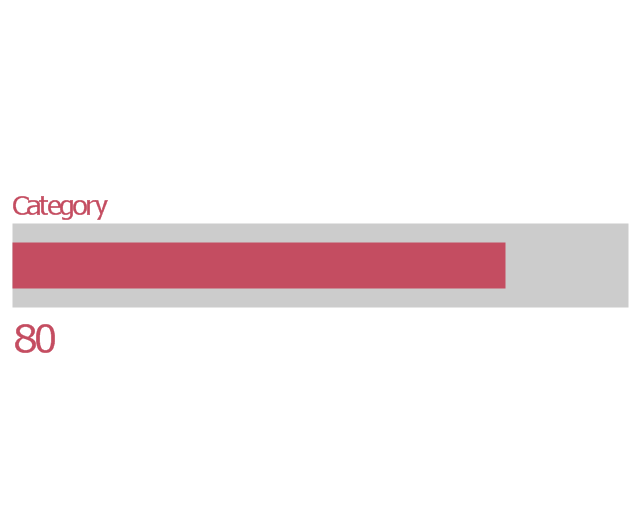
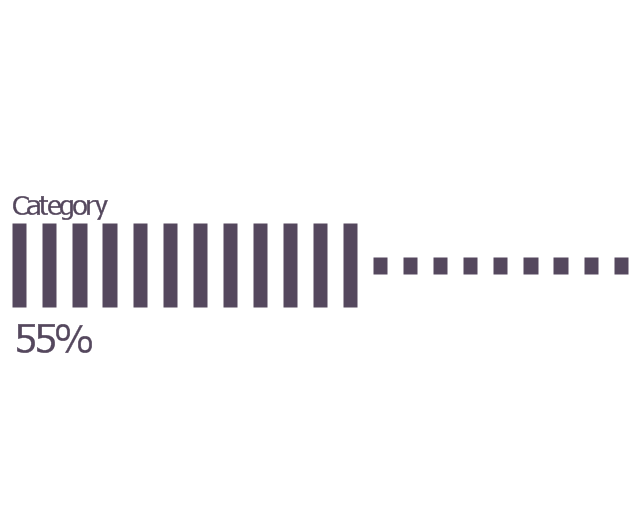
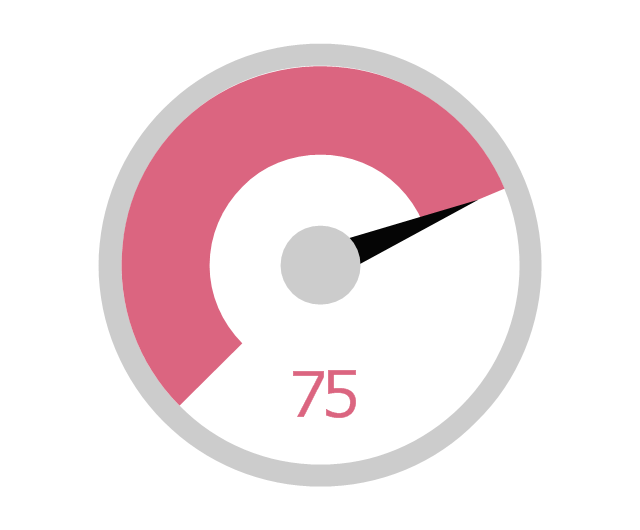
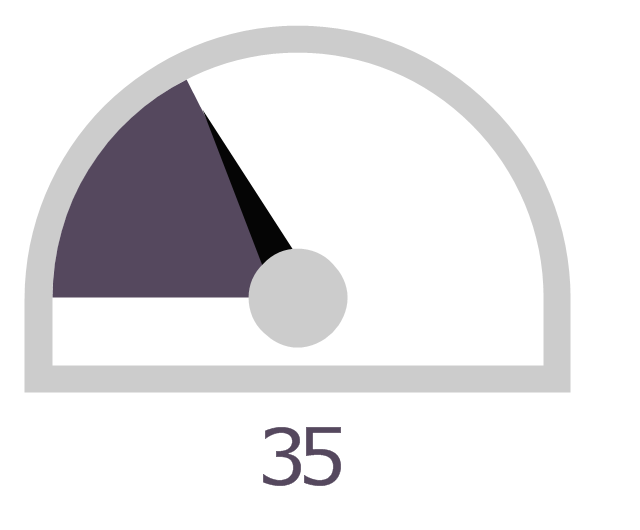
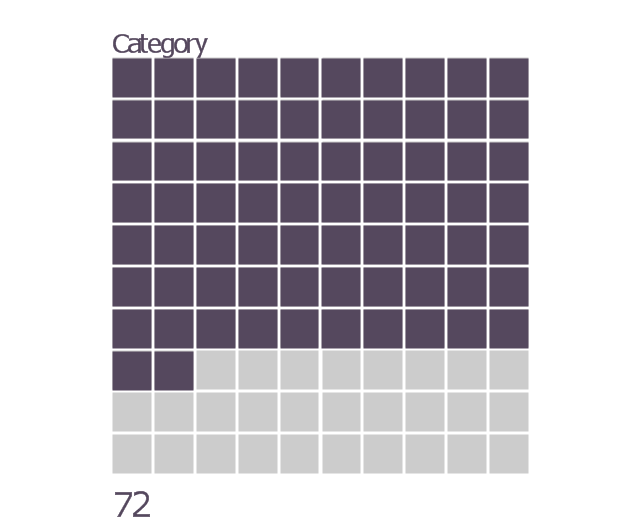
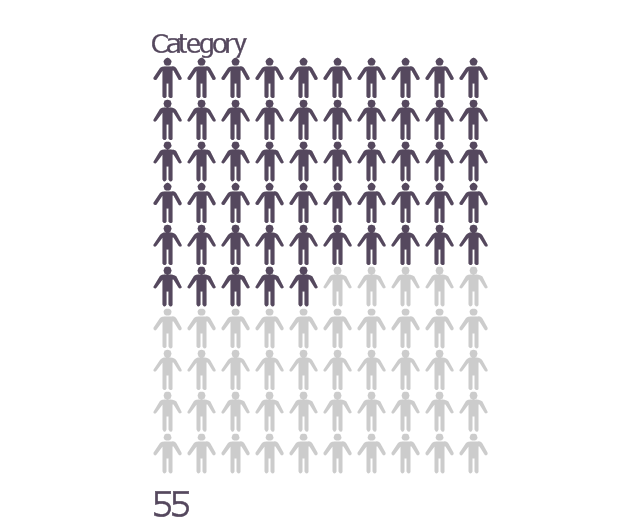
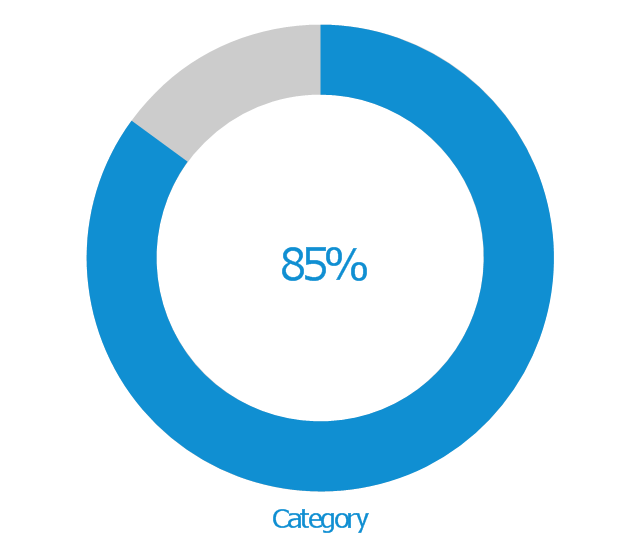
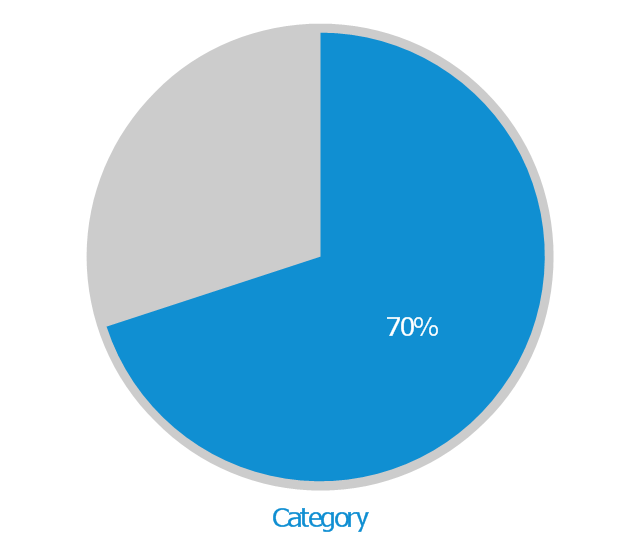
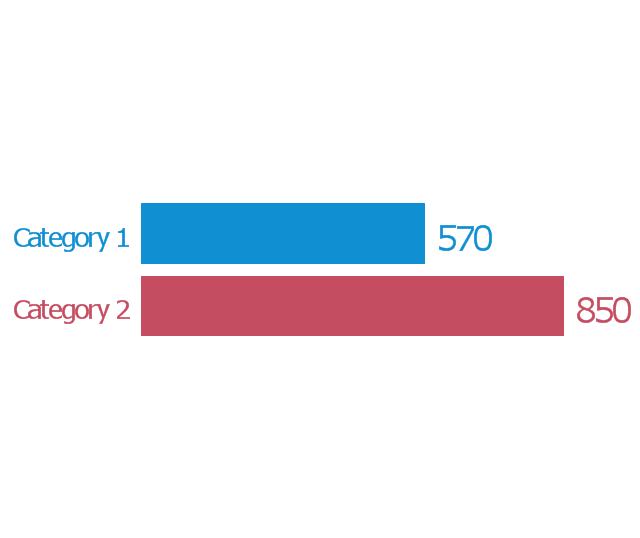
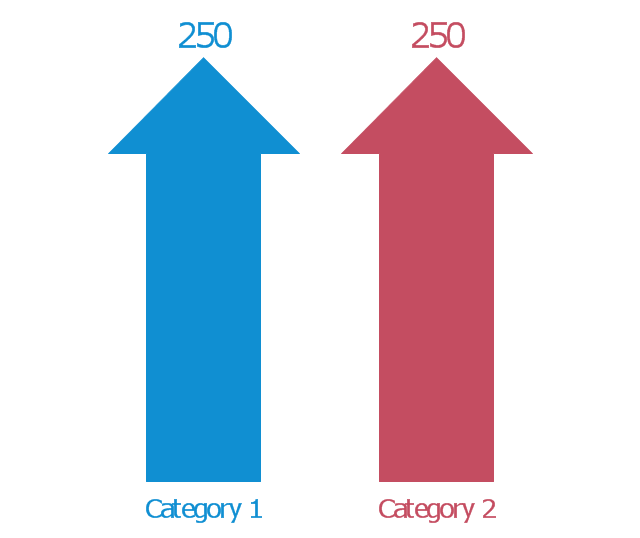
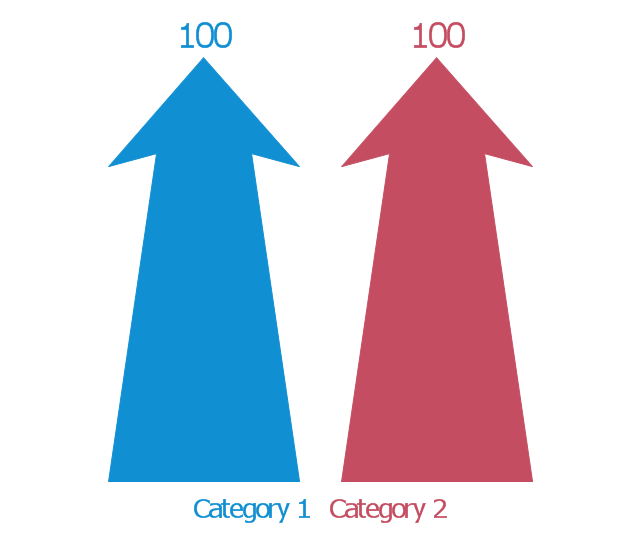
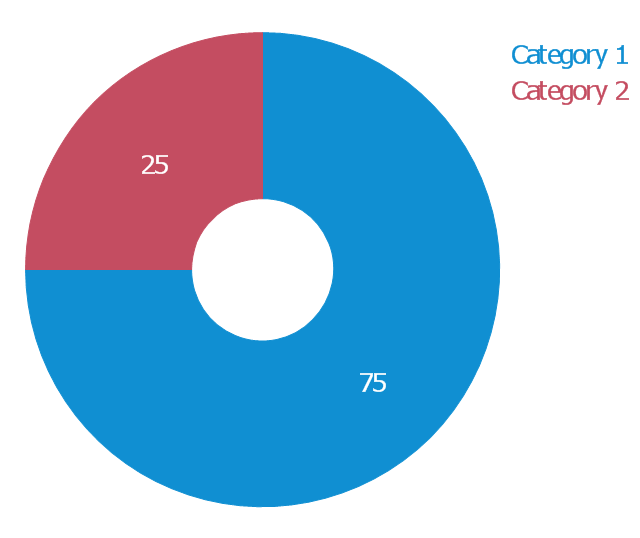
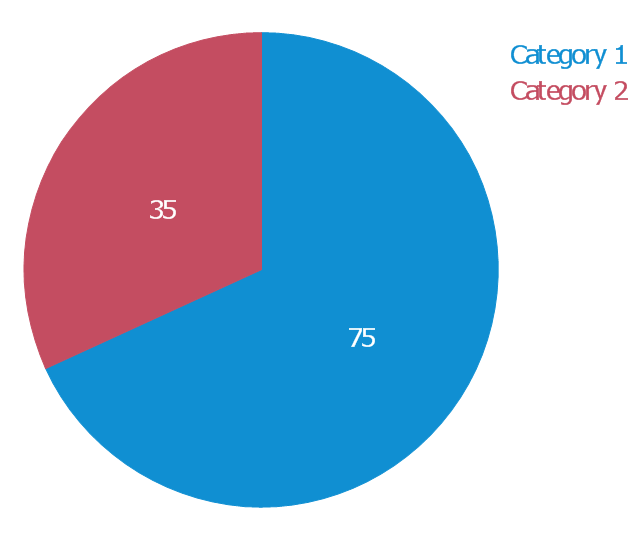
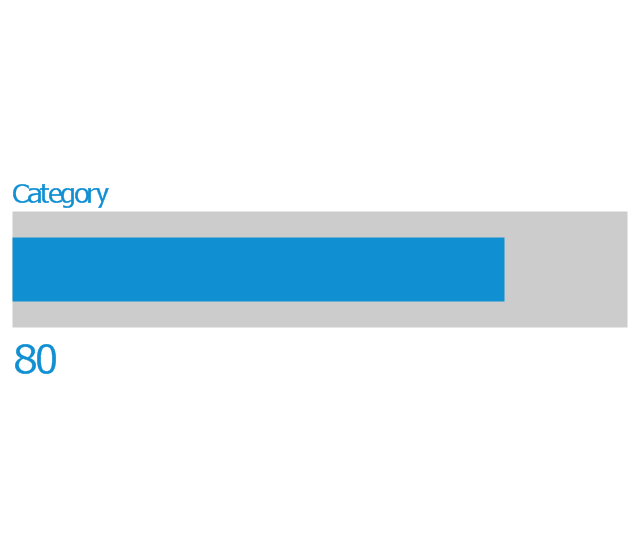
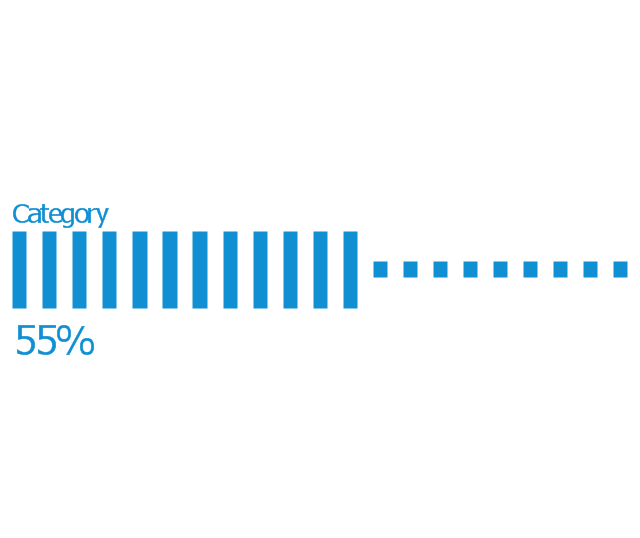
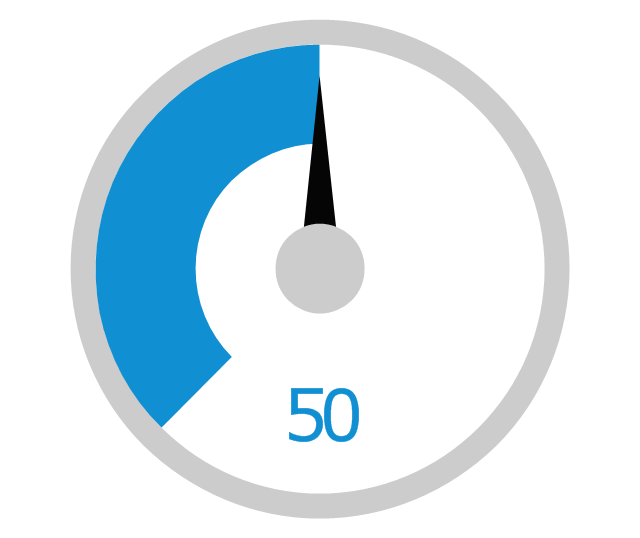
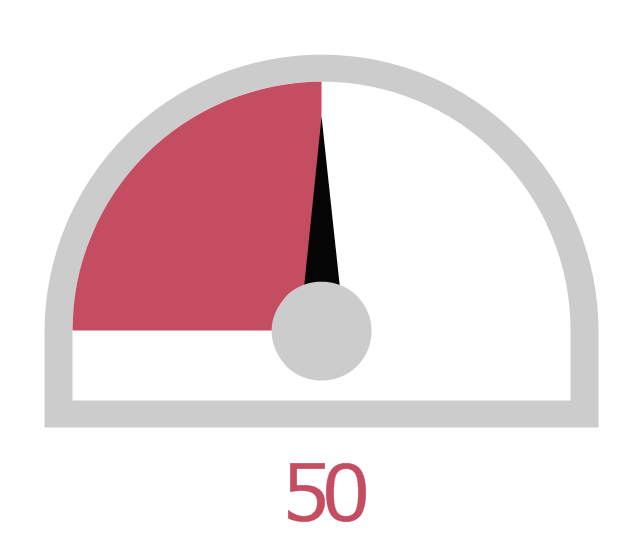
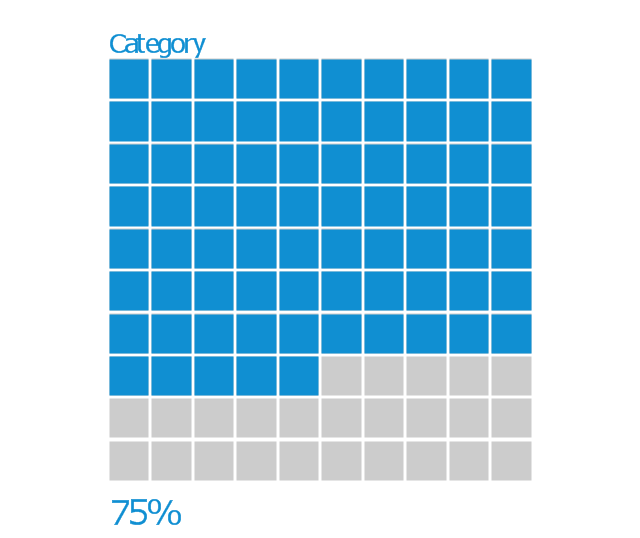
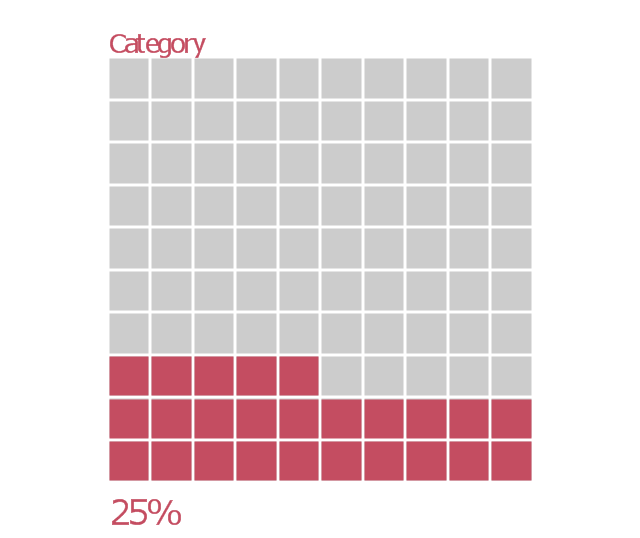
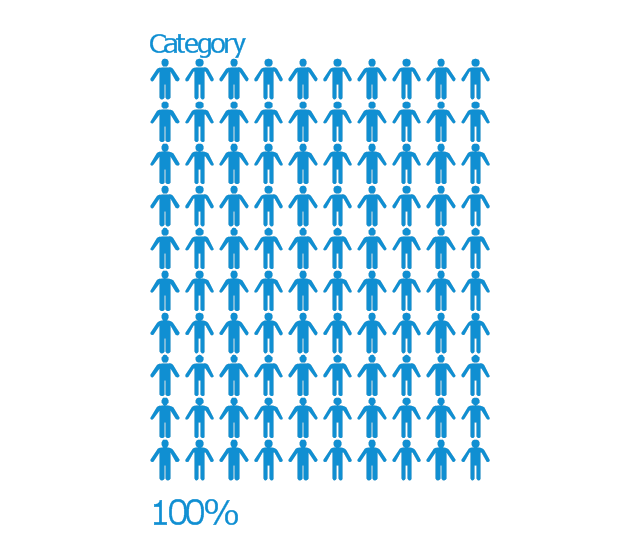
The vector stencils library "Education indicators" contains 12 graphic indicators.
Use these visual indicators to design your educational infogram.
The vector stencils library "Education indicators" is included in the Education Infographics solution from the Business Infographics area of ConceptDraw Solution Park.
Use these visual indicators to design your educational infogram.
The vector stencils library "Education indicators" is included in the Education Infographics solution from the Business Infographics area of ConceptDraw Solution Park.
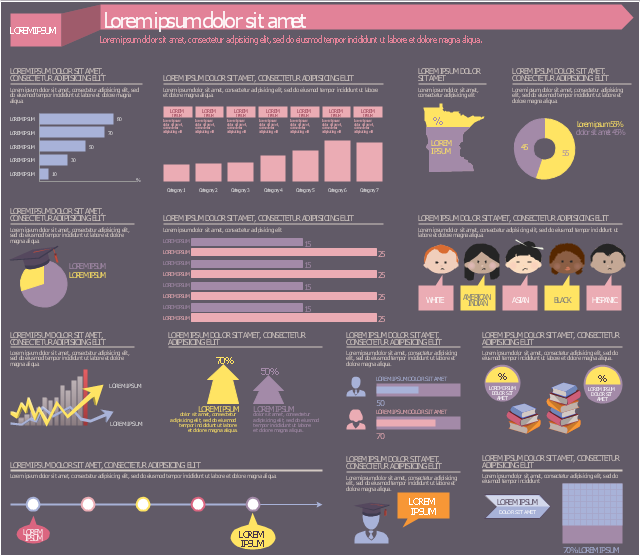
This education infographic template consists of design elements: callouts, horizontal bar chart, column chart (vertical bar graph), state map contour, donut chart indicator, pie chart indicator, horizontal bar chart indicators, arrow chart indicator, bullet indicators, square chart 10x10 indicator, pictograms.
Simply add text to design your own educational infogram.
The template "Education infogram 5" for the ConceptDraw PRO diagramming and vector drawing software is included in the Education Infographics solition from the area "Business Infographics" in ConceptDraw Solution Park.
Simply add text to design your own educational infogram.
The template "Education infogram 5" for the ConceptDraw PRO diagramming and vector drawing software is included in the Education Infographics solition from the area "Business Infographics" in ConceptDraw Solution Park.
Used Solutions
The vector stencils library "Management indicators" contains 14 visual indicators.
Use it to create your management infogram in the ConceptDraw PRO diagramming and vector drawing software.
The example "Management indicators - Vector stencils library" is included in the solution "Marketing infographics" from the "Business infographics" area of ConceptDraw Solution Park.
Use it to create your management infogram in the ConceptDraw PRO diagramming and vector drawing software.
The example "Management indicators - Vector stencils library" is included in the solution "Marketing infographics" from the "Business infographics" area of ConceptDraw Solution Park.
HelpDesk
How to Connect Tabular Data (CSV) to a Graphic Indicator on Your Live Dashboard
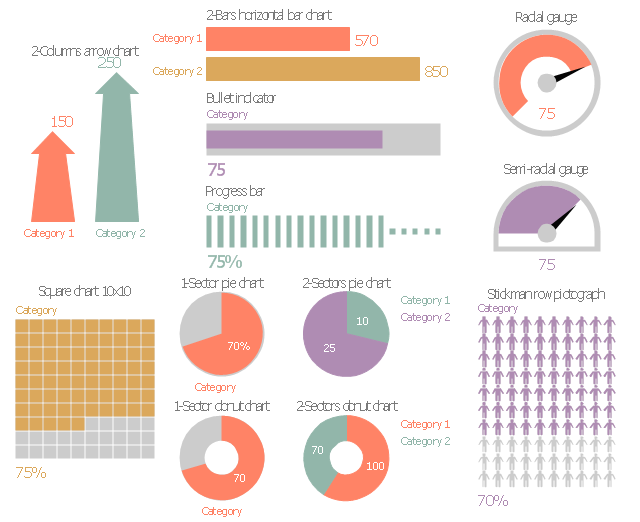
The Time Series Dashboard Solution can be used to create the interactive Time Series Charts as Column Charts, Line Charts, or Bar Charts for your interactive dashboard.The vector stencils library "Marketing indicators" contains 12 graphic indicators: horizontal bar chart, pie chart, arrow chart, donut chart, square chart, stickman row pictograph, progress bar, bullet indicator, radial gauge, semi-radial gauge.
Use these visual indicators to design your marketing infograms.
The shapes example "Design elements - Marketing indicators" was created using the ConceptDraw PRO diagramming and vector drawing software extended with the Marketing Infographics solition from the area "Business Infographics" in ConceptDraw Solution Park.
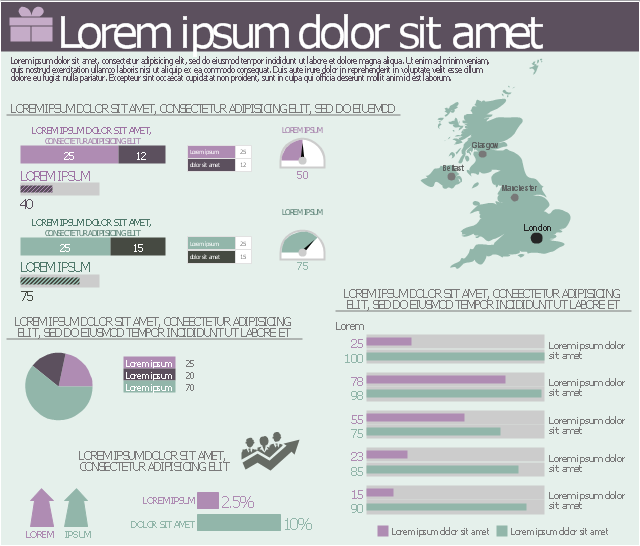
This marketing infographic template consists of design elements: title block, callout blocks, pictograms, thematic map, divided bar diagrams, pie chart, bullet indicators, arrow chart indicator, horizontal bar graph indicator, semi-radial gauge indicators.
Use it to create your marketing infograms in the ConceptDraw PRO diagramming and vector drawing software.
The template "Marketing infogram 4" is included in the Marketing Infographics solution from the Business Infographics area of ConceptDraw Solution Park.
Use it to create your marketing infograms in the ConceptDraw PRO diagramming and vector drawing software.
The template "Marketing infogram 4" is included in the Marketing Infographics solution from the Business Infographics area of ConceptDraw Solution Park.
Used Solutions
Marketing Plan Infographic
You need design the Marketing Plan Infographic and dream to find the useful tools to draw it easier, quickly and effectively? ConceptDraw PRO offers the unique Marketing Infographics Solution from the Business Infographics Area that will help you!HelpDesk
How to Connect Text Data to a Time Series Chart on Your Live Dashboard
Time Series Dashboard means an integration of some type of diagrams: Line Charts, Bar Charts, Column Charts, and Dot Plots on a single space. The ConceptDraw Time Series Dashboard solution can be used to create the interactive Time Series dashboard. The libraries of Time Series Charts solution contain the Live Objects, that can change their appearance depending on the external data. Each chart from the Time Series dashboard displays particular source data. You can include Time Series Charts in your business or technical dashboards to show and compare the items changing over time.
 Status Dashboard
Status dashboard solution extends ConceptDraw PRO software with templates, samples and vector stencils libraries with graphic indicators for drawing the visual dashboards showing status data.
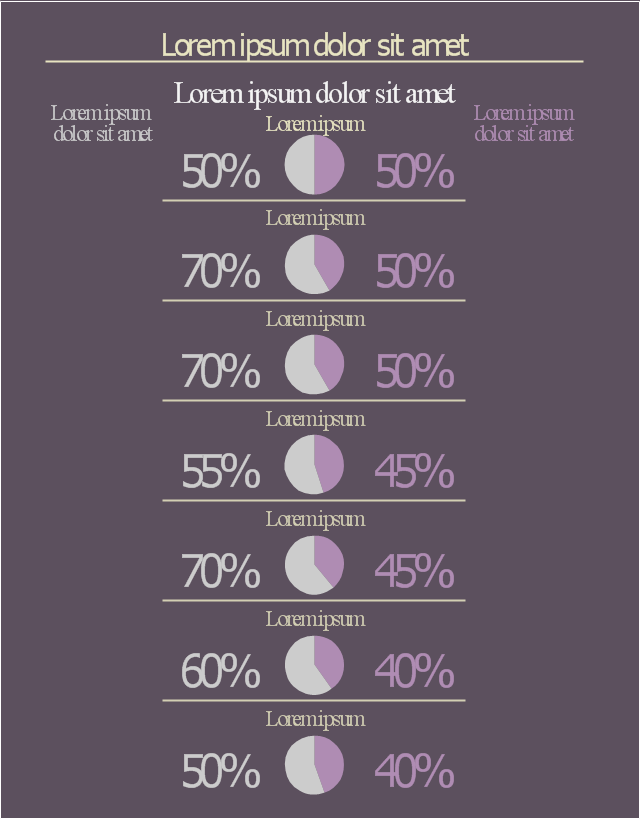
This marketing infographic template consists of design elements: callout blocks, pie chart indicators, background.
Use it to create your marketing infograms in the ConceptDraw PRO diagramming and vector drawing software.
The template "Marketing infogram 9" is included in the Marketing Infographics solution from the Business Infographics area of ConceptDraw Solution Park.
Use it to create your marketing infograms in the ConceptDraw PRO diagramming and vector drawing software.
The template "Marketing infogram 9" is included in the Marketing Infographics solution from the Business Infographics area of ConceptDraw Solution Park.
 Meter Dashboard
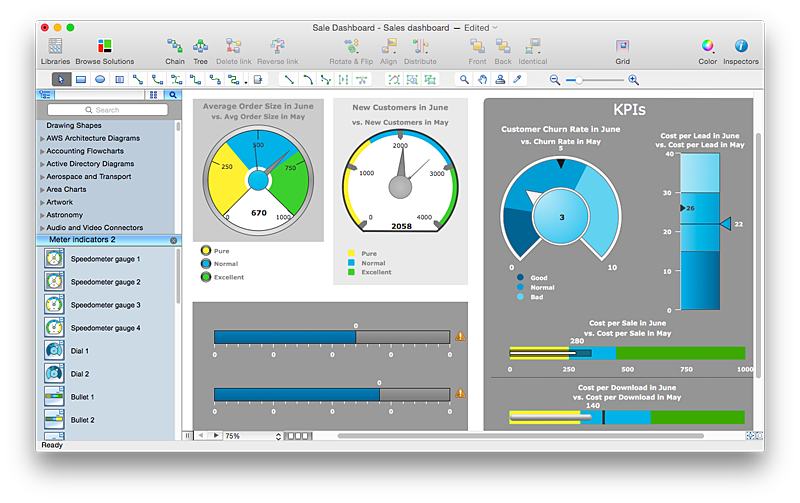
Meter dashboard solution extends ConceptDraw PRO software with templates, samples and vector stencils library with meter indicators for drawing visual dashboards showing quantitative data.
Make an Infographic
You want to make an infographic and need the useful and convenient drawing tools for this? In this case the ConceptDraw PRO software extended with Education Infographics Solution is a real godsend for you.- Education infogram 4 - Template | Education infogram 5 - Template ...
- How to Create a Typography Infographic Using ConceptDraw PRO ...
- Infographic Horizontal Bar
- Performance Indicators | What is a KPI? | Dashboard | Example Of A ...
- How to Create a Typography Infographic Using ConceptDraw PRO
- Indicator Images And Example
- Education | Presentations in Educational Process | Design elements ...
- Management indicators - Vector stencils library | Education ...
- Management indicators - Vector stencils library | Management ...
- Basic Flowchart Symbols and Meaning | Marketing Plan Infographic ...
- Infographics Bullets
- Performance Indicators | How to Connect Tabular Data (CSV) to a ...
- Key Performance Indicators Infographics
- Design elements - Marketing indicators | Process Flowchart | Create ...
- Management indicators - Vector stencils library | Sales performance ...
- Mac OS X Lion user interface - Vector stencils library | Typography ...
- Performance Indicators | Design elements - Comparison charts and ...
- How to Draw Pictorial Chart. How to Use Infograms | Infographic ...
- How to Connect Tabular Data (CSV) to a Graphic Indicator on Your ...
- Design elements - Marketing indicators | | Tree Network Topology ...
