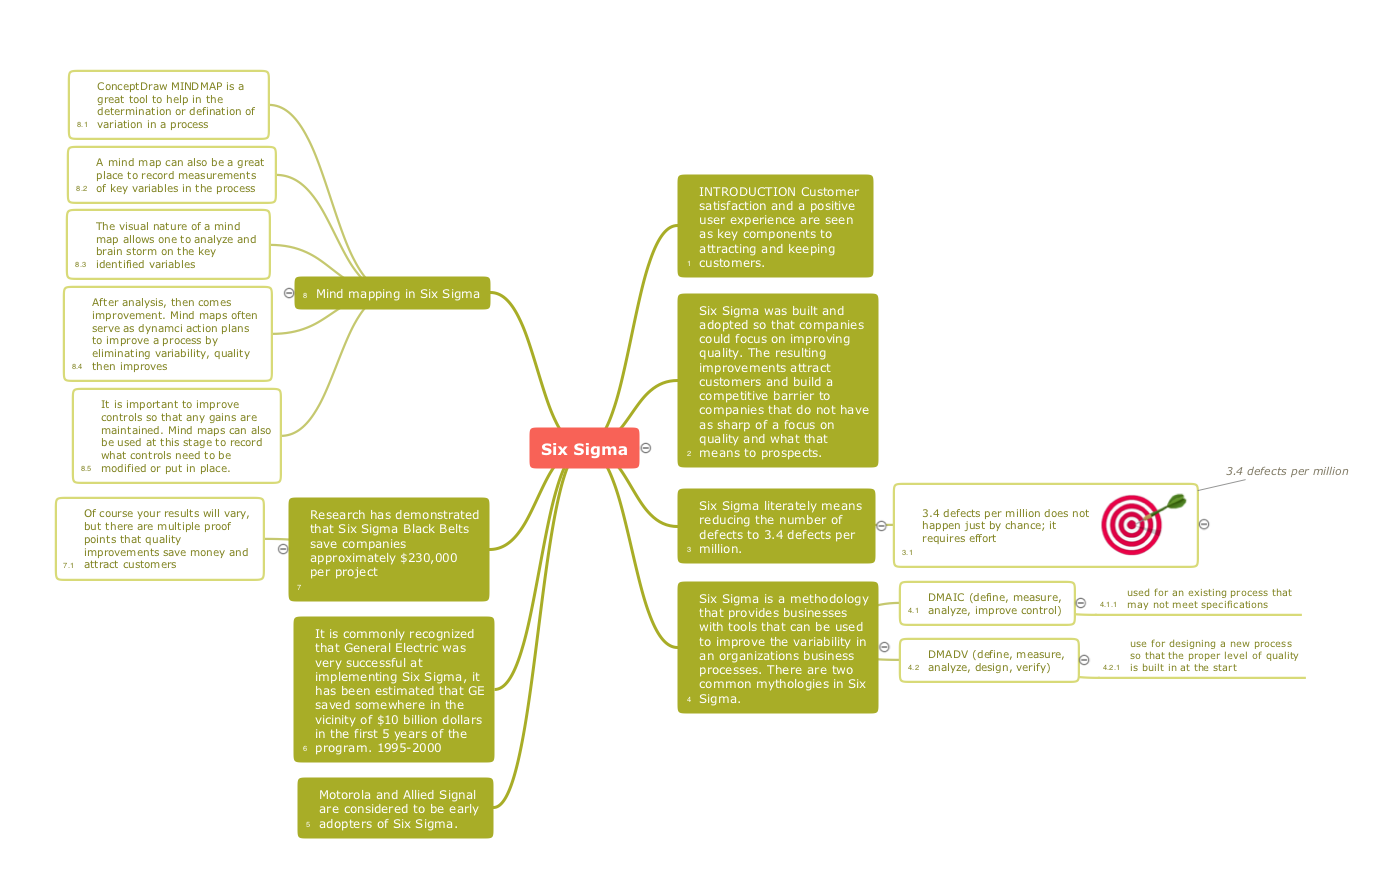
Probability Quality Control Tools
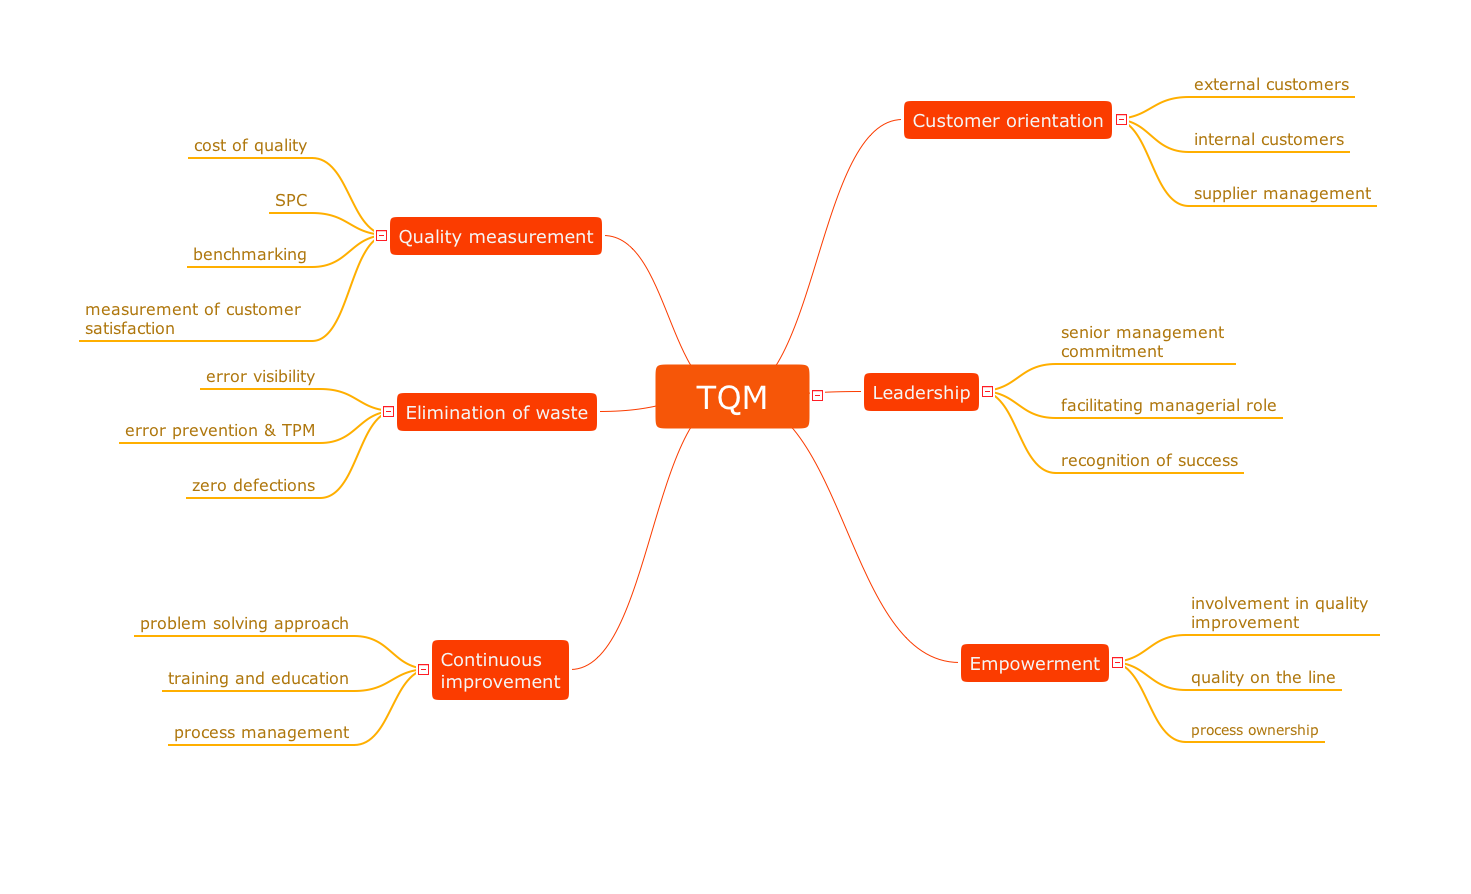
The Total Quality Management Diagram solution helps your organization visualize business and industrial processes. Create Total Quality Management diagrams for business process with ConceptDraw software.TQM Diagram — Professional Total Quality Management
The Total Quality Management Diagram solution helps you and your organization visualize business and industrial processes. Create Total Quality Management diagrams for business process with ConceptDraw software.Constant improvement of key performance indicators
There are available tool to lend a fresh look to quality procedures - ConceptDraw MINDMAP.Performance Indicators
ConceptDraw PRO diagramming and vector drawing software offers the useful tools of the Sales Dashboard solution from the Marketing area for easy creating professional looking live dashboards which allow to track the business sales activity and progress thanks to representing the Key Performance Indicators (KPIs) on them.Mind Mapping in the Quality Management
ConceptDraw MINDMAP has a addition to the ConceptDraw Solution Park that provides a creative approach to visualizing quality processes, Quality Mind Map Solution.TQM Diagram Tool
The Total Quality Management Diagram solution helps you and your organization visualize business and industrial processes. Create Total Quality Management diagrams for business process with ConceptDraw software.What is a Quality Management
Successful quality management implemented in a company of any size is a critical component of a company organization.Quality Improvement
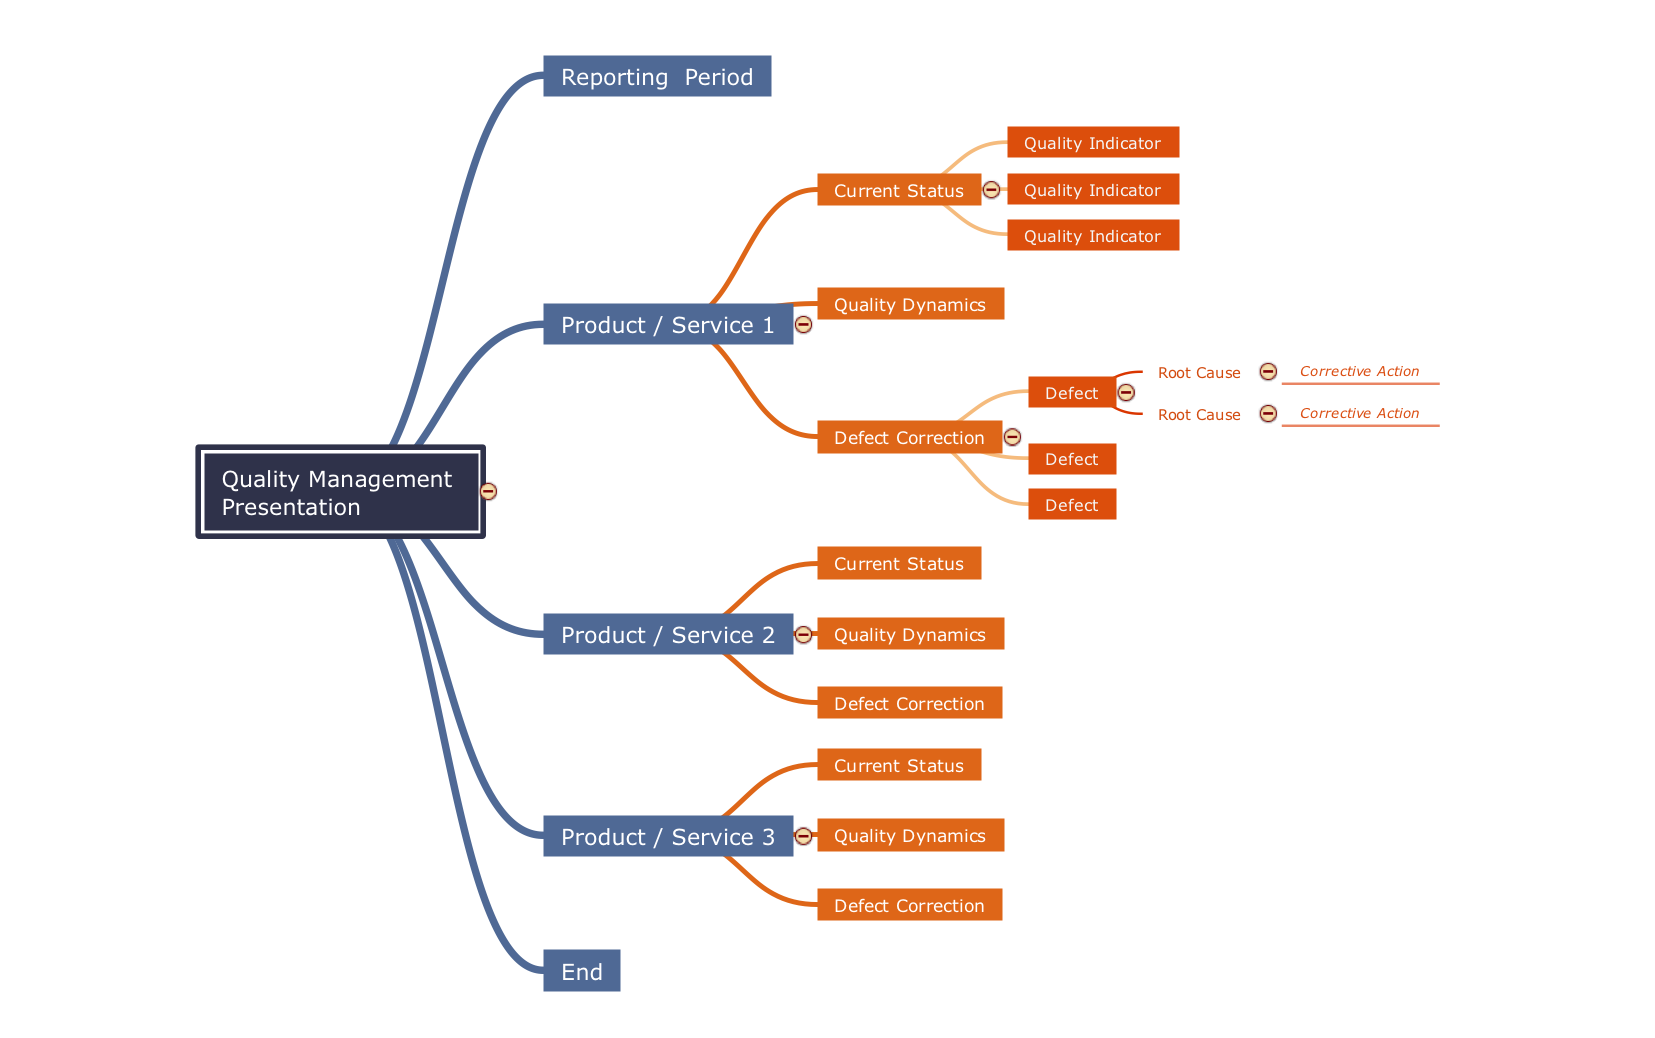
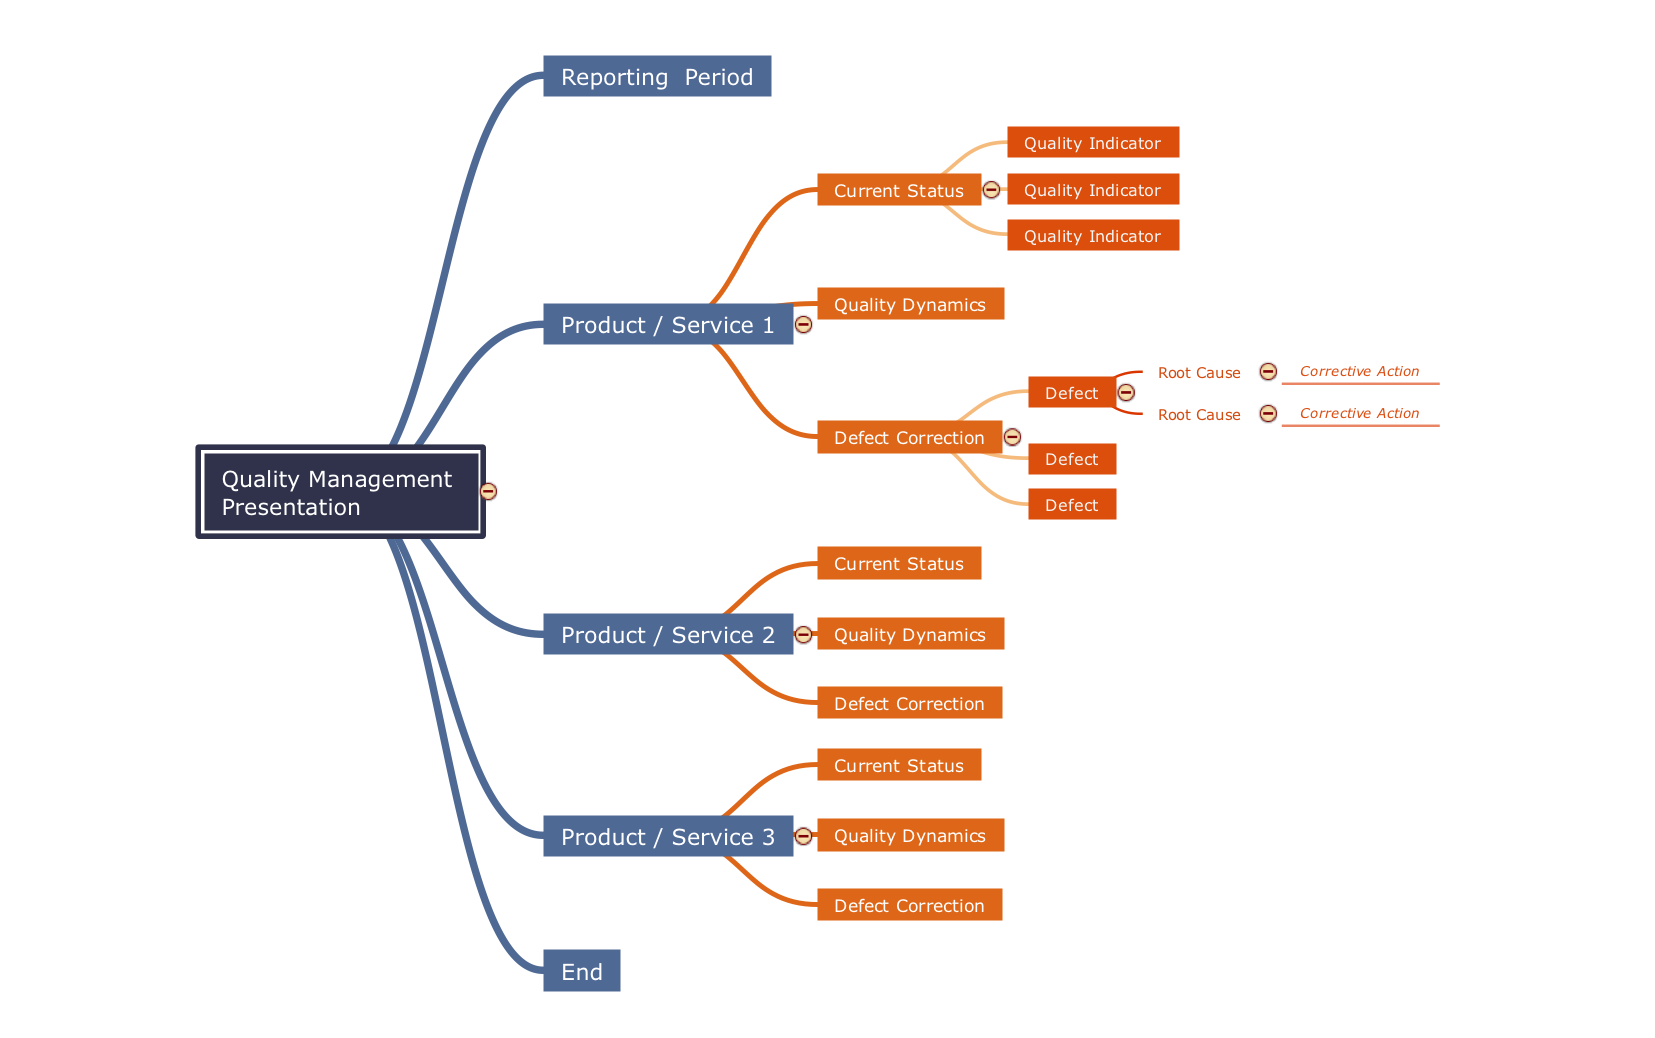
Constant improvement of key performance indicators that are related to quality is a step in the right direction for a company interested in market growth.Quality management presentation
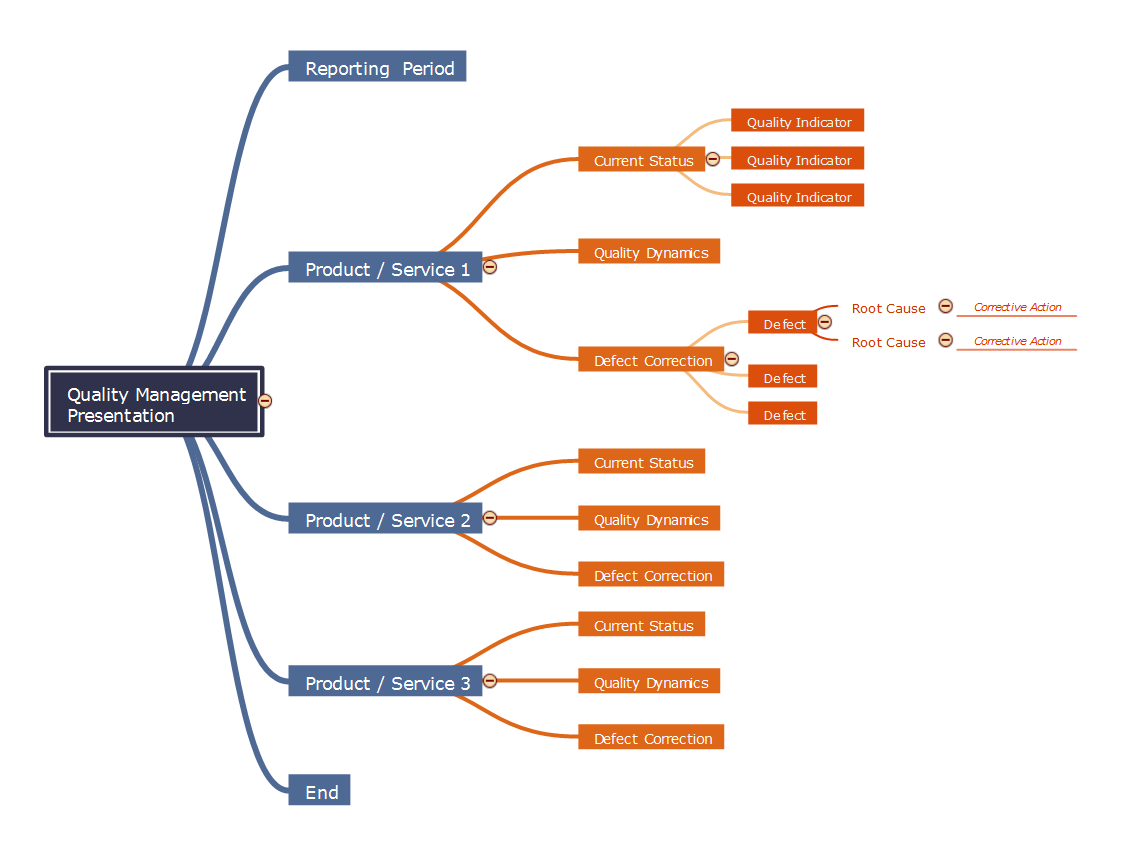
The presence of serious competition in a market economics obliges to pay great attention to quality issues. That's why today a quality management became an essential part of any business. Quality management is an approach responsible for the processes of managing, ensuring and improvement quality, and also increasing efficiency and flexibility of any business. The presentation is a special form of representation the information. Its main objective is to interest the audience in promoted product, service, idea, etc. In accordance with the theme of presentation and conditions of its carrying out is chosen the video for product demonstration, sound and color design. The brighter presentation is the better and more attractive for the target audience. The presentation finds its active use in any field, including marketing, management, and quality management. ConceptDraw MINDMAP software and numerous solutions from the Quality area of ConceptDraw Solution Park supply their users with powerful visualization tools for providing the quality control and improvement, and for designing quality Mind Maps, diagrams and presentations.TQM Diagram Example
The Total Quality Management Diagram solution helps you and your organization visualize business and industrial processes. Create Total Quality Management diagrams for business process with ConceptDraw software.Why do you need the quality management for the organization
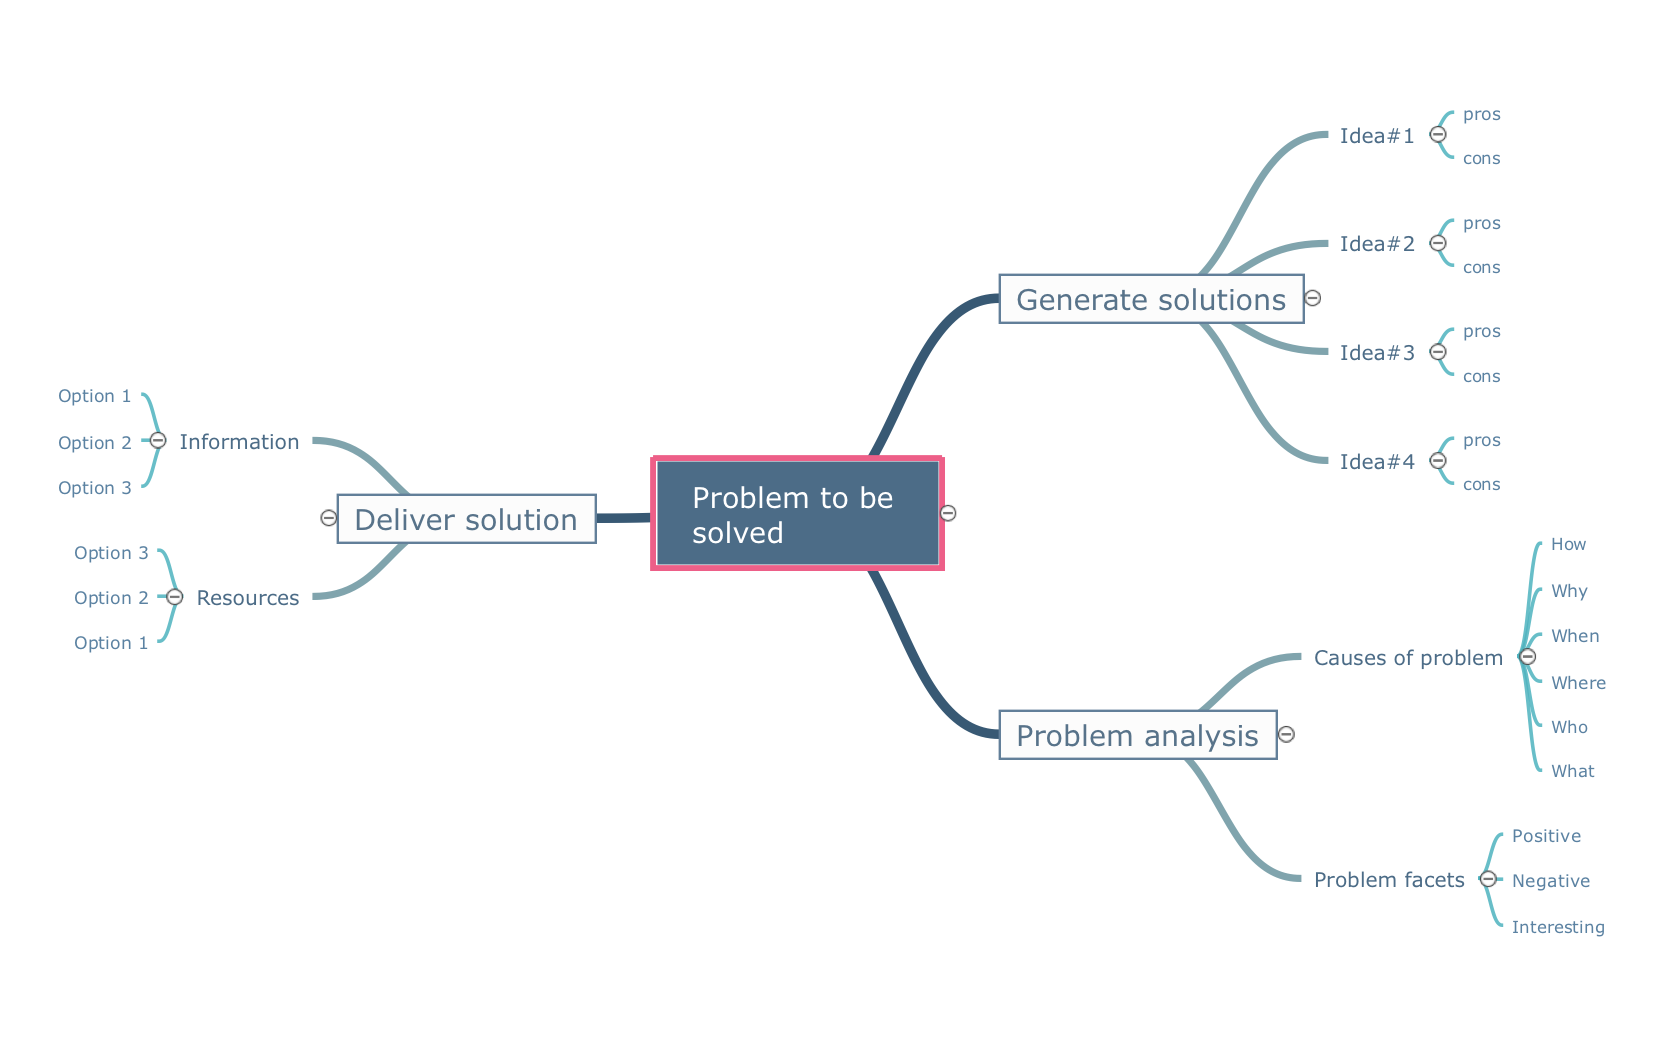
You can describe your own quality processes, brainstorm, and structure quality issues; then you can easily and quickly present it to your team. Quality Management Mind Maps - Presentations, Meeting Agendas, Problem will be solved.
 Status Dashboard
Status dashboard solution extends ConceptDraw PRO software with templates, samples and vector stencils libraries with graphic indicators for drawing the visual dashboards showing status data.
Quality Mind Maps - samples and templates
Use samples and templates to describe your own quality processes, brainstorm, and structure quality issues.Fundamental Tool in Quality Management
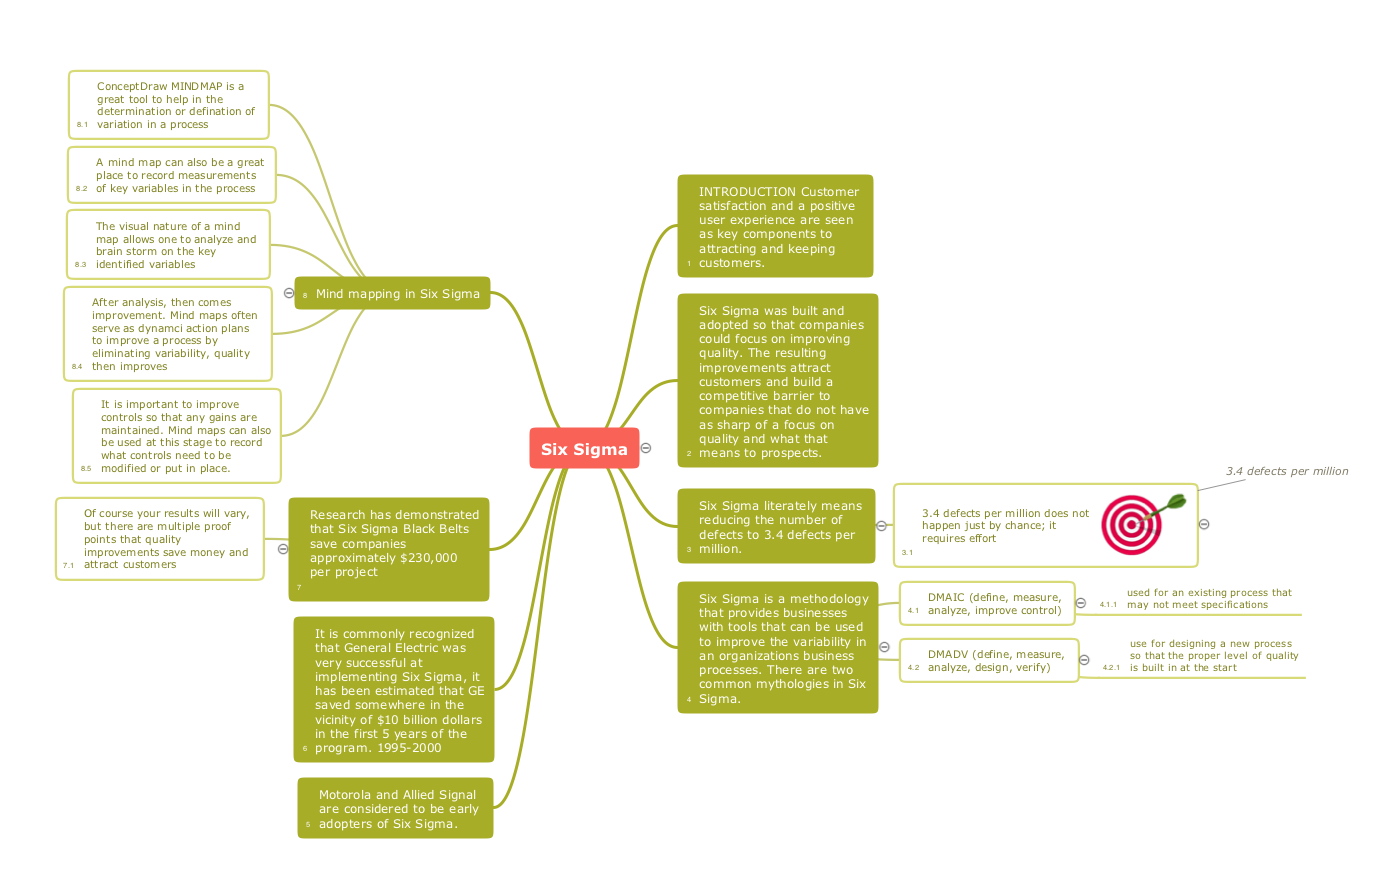
ConceptDraw MINDMAP is a fundamental tool in quality management to describe visual instructions on any process.Quality Criteria MindMap
Quality Management Mind Maps - Presentations, Meeting Agendas, Problem will be solved. The visual form of mind maps is helpful in all stages of quality management, from describing problem to describing and documenting a decision.- Constant improvement of key performance indicators | TQM Diagram ...
- Key Performance Indicators In Tqm
- Constant improvement of key performance indicators | TQM Diagram ...
- Total Quality Management TQM Diagrams | Sales Dashboard ...
- Status Dashboard | TQM Diagram — Professional Total Quality ...
- Constant improvement of key performance indicators | TQM Diagram ...
- What Arethe Indicator Of Total Quality Management
- Constant improvement of key performance indicators | TQM Diagram ...
- Constant improvement of key performance indicators | TQM Diagram ...
- Performance Indicators | TQM Diagram — Professional Total Quality ...
- PM Dashboards | TQM Diagram — Professional Total Quality ...
- Organizational Structure Total Quality Management | Mind Mapping ...
- Constant improvement of key performance indicators | The Facts ...
- Sales Organization | Total Quality Management TQM Diagrams ...
- Total Quality Management Value | Quality Control | Total Quality ...
- Quality Improvement | Mind Mapping in the Quality Management ...
- Constant improvement of key performance indicators | What is a ...
- Quality Performance Indicators
- Probability Quality Control Tools | Total Quality Management TQM ...
- Diagram Business Indicators


