 Entity-Relationship Diagram (ERD)
Entity-Relationship Diagram (ERD) solution extends ConceptDraw PRO software with templates, samples and libraries of vector stencils from drawing the ER-diagrams by Chen's and crow’s foot notations.
Fishbone Diagram Problem Solving
The Ishikawa diagram, Cause and Effect diagram, Fishbone diagram — all they are the names of one and the same visual method for working with causal connections. Originally invented by Kaoru Ishikawa to control the process quality, the Ishikawa diagram is well proven in other fields of management and personal scheduling, events planning, time management. It is a chart in the form of a fish, whose head is a problem, the fins are variants for its causes. To design easily the Fishbone diagram, you can use a special ConceptDraw PRO vector graphic and diagramming software which contains the powerful tools for Fishbone diagram problem solving offered by Fishbone Diagrams solution for the Management area of ConceptDraw Solution Park.CCTV Network Example
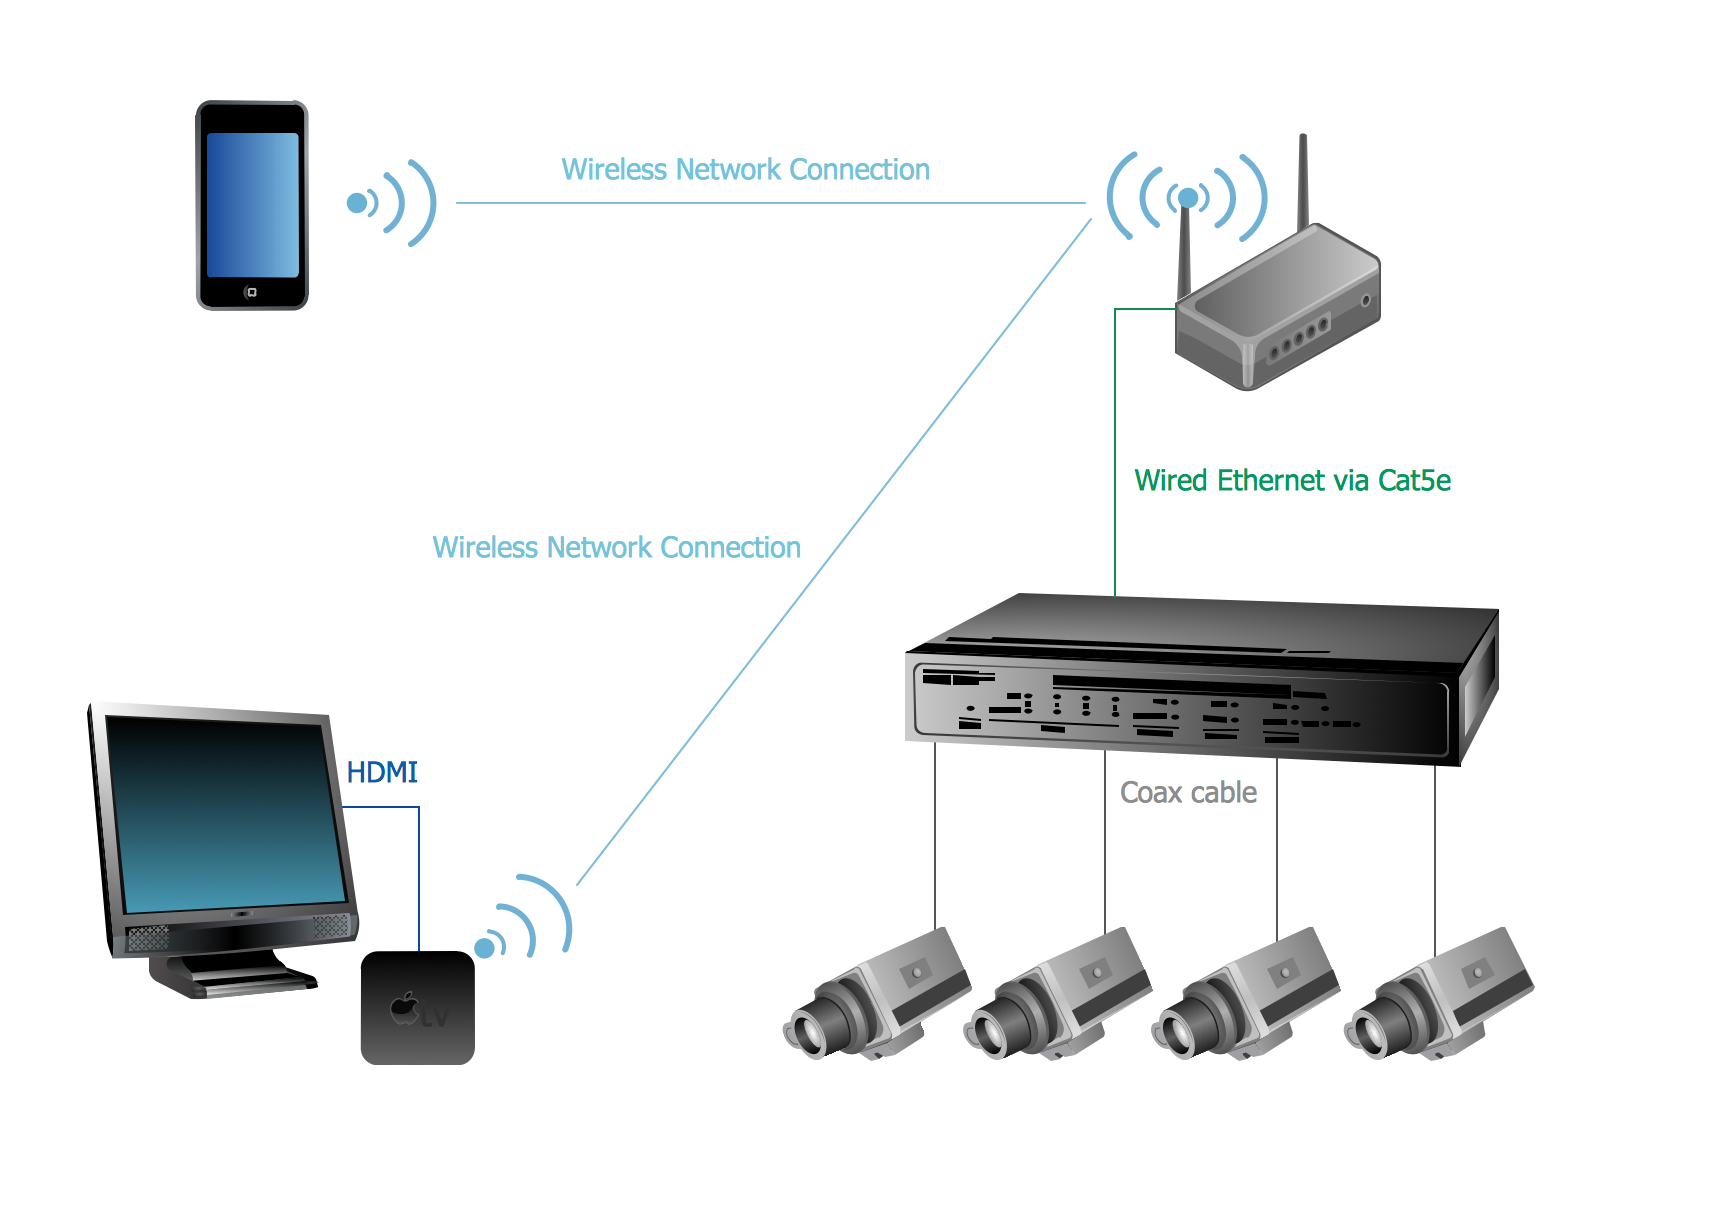
The following examples cctv network were created in ConceptDraw PRO diagramming and vector drawing software using the Audio, Video, Media Solution. Using this easily customizable cctv network template you can represent any existing cctv network.How To Do A Mind Map In PowerPoint
ConceptDraw MINDMAP - an excellent tool for exporting mind maps to PowerPoint to visualize and presenting your project. You can simply generate, change, update your mindmap and then make a presentation in PowerPoint.TQM Software — Build Professional TQM Diagrams
The Total Quality Management Diagram solution helps you and your organization visualize business and industrial processes. Create Total Quality Management diagrams for business process with ConceptDraw software.- Entity- Relationship Diagram (ERD) | Probability Quality Control ...
- Industrial transport - Vector stencils library | Truck vehicle clipart ...
- Industrial vehicles - Vector stencils library | Industrial transport ...
- Industrial transport - Design elements | Design elements - Industrial ...
- Industrial vehicles - Vector stencils library | Road Transport - Design ...
- Industrial vehicles - Vector stencils library | Design elements ...
- Examples Of Relation Diagram Of Tqm
- Process Flowchart | Entity- Relationship Diagram (ERD) | How to ...
- Quality Drawings Industrial
- Symbols Clipart And Design Elements
- Winter Sports Vector Clipart . Medal Map. Spatial Infographics ...
- Maintenance - Vector stencils library | Manufacturing and ...
- Process Flowchart | Design elements - Industrial equipment | Road ...
- How to Create a HR Process Flowchart Using ConceptDraw PRO ...
- Human Resource Development | Human Resource Management ...
- Industrial Process System Diagram
- How to Purchase ConceptDraw Products for Academic/Nonprofit ...
- Industrial Design
- Presentation Clipart | Business People Clipart | Arrows - Vector ...
- Process Flowchart | HR management process - Flowchart | How to ...


