Basic Flowchart Symbols and Meaning
Flowcharts are the best for visually representation the business processes and the flow of a custom-order process through various departments within an organization. ConceptDraw PRO diagramming and vector drawing software extended with Flowcharts solution offers the full set of predesigned basic flowchart symbols which are gathered at two libraries: Flowchart and Flowcharts Rapid Draw. Among them are: process, terminator, decision, data, document, display, manual loop, and many other specific symbols. The meaning for each symbol offered by ConceptDraw gives the presentation about their proposed use in professional Flowcharts for business and technical processes, software algorithms, well-developed structures of web sites, Workflow diagrams, Process flow diagram and correlation in developing on-line instructional projects or business process system. Use of ready flow chart symbols in diagrams is incredibly useful - you need simply drag desired from the libraries to your document and arrange them in required order. There are a few serious alternatives to Visio for Mac, one of them is ConceptDraw PRO. It is one of the main contender with the most similar features and capabilities.
The vector stencils library "Window elements" contains 24 window elements: frames, boxes and buttons.
Use it to design graphic user interface (GUI) of your Windows 8 software application.
"A window is a graphical control element. It consists of a visual area containing some of the graphical user interface of the program it belongs to and is framed by a window decoration. It usually has a rectangular shape that can overlap with the area of other windows. It displays the output of and may allow input to one or more processes.
Windows are primarily associated with graphical displays, where they can be manipulated with a pointer by employing some kind of pointing device.
A graphical user interface (GUI) using windows as one of its main "metaphors" is called a windowing system, whose main components are the display server and the window manager." [Window (computing). Wikipedia]
The design elements example "Window elements - Vector stencils library" was created using the ConceptDraw PRO diagramming and vector drawing software extended with the Windows 8 User Interface solution from the Software Development area of ConceptDraw Solution Park.
Active Directory Diagram
Active Directory (AD) is a directory management service introduced by Microsoft Corporation for Windows domain networks. This service uses the Lightweight Directory Access Protocol (LDAP) and provides quick access to the included information about large structural units such as domains, organizational units, sites, and also about simple objects, such as users names with detailed information about them - contacts information, access rights, etc. Active Directory Diagram is a representation of the network structure in clear graphical format. It is a scheme of correlations of service components with preset degree of detailed elaboration. Active Directory Diagram makes the work of network administrators with Active Directory network structure more easy and convenient, allows plan and service the network quicker and more qualitatively. The help of ConceptDraw PRO software extended with Active Directory Diagrams solution from the Computer and Networks area is indispensable for easily and quickly creation the highly detailed Active Directory Diagrams.Value Stream Mapping Symbols
VSM symbols are the best for a production process designing. The entire Value Stream Mapping method uses a graphical representation of the manufacturing process, factors' pros and cons, that all stakeholders can easily understand. Value Stream Mapping is a graphical technique that provides possibilities to improve analysis of a manufacturing process, at the stage of the transferring information or materials that required to deliver a product or service to the customer.ERD Symbols and Meanings
Entity Relationship Diagram (ERD) is a popular software engineering tool for database modeling and illustration the logical structure of databases, which uses one of two notations - Chen's or Crow’s Foot. Crow's foot notation is effective when used in software engineering, information engineering, structured systems analysis and design. Each of these notations applies its own set of ERD symbols. Crow's foot diagrams use boxes to represent entities and lines between these boxes to show relationships. Varied shapes at the ends of lines depict the cardinality of a given relationship. Chen's ERD notation is more detailed way to represent entities and relationships. ConceptDraw PRO application enhanced with all-inclusive Entity-Relationship Diagram (ERD) solution allows design professional ER diagrams with Chen's or Crow’s Foot notation on your choice. It contains the full set of ready-to-use standardized ERD symbols and meanings helpful for quickly drawing, collection of predesigned ERD samples, examples and templates. ConceptDraw Pro is a great alternative to Visio for Mac users as it offers more features and can easily handle the most demanding professional needs.
Network Diagram Software LAN Network Diagrams & Diagrams for LAN Physical Office Network Diagrams
Physical LAN Diagrams illustrate the communication schemes of Local Area Networks, the physical network connection of computers and networks arrangement on the small areas - at homes, offices, and other buildings. ConceptDraw PRO is a perfect network diagramming software with samples and examples of WAN and LAN Diagrams, templates and collection of network components libraries. Computer Network Diagrams Solution for ConceptDraw PRO Mac and Windows is ideal for IT professionals, network engineers and network designers who need to visualize network architecture, to document LANs physical structure and arrangement, to draw Local Area Network (LAN) diagrams and schematics, WAN diagrams, physical office network diagrams and topologies, wiring drawings, etc. You can design all them easy using the predesigned vector objects of computers and computer network devices, hardware devices, peripheral devices, external digital devices, internet and logical symbols, and many other stencils from the Computer Network Diagrams libraries. ConceptDraw PRO offers a powerful and easy-to-use solution for those who looking for a Visio alternative for Mac. It is a world-class diagramming platform with dynamic presentation power.
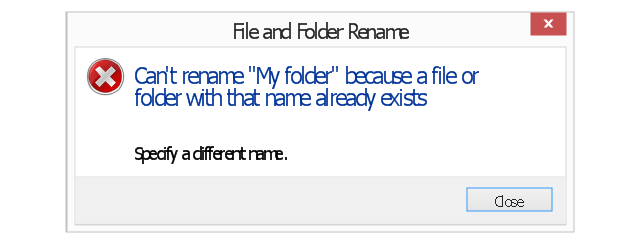
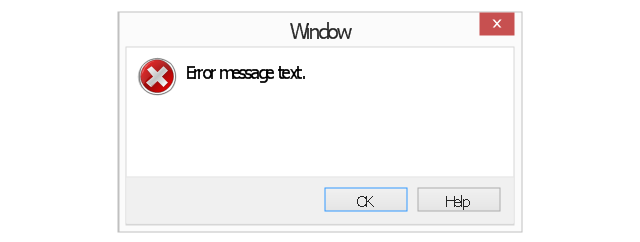
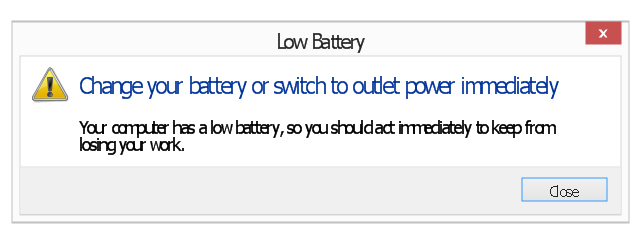
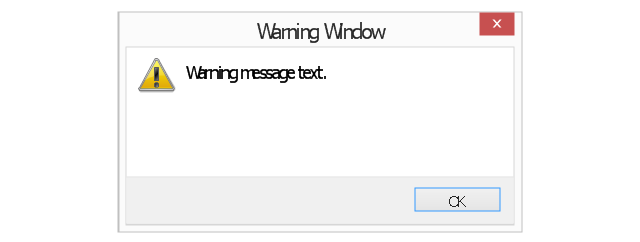
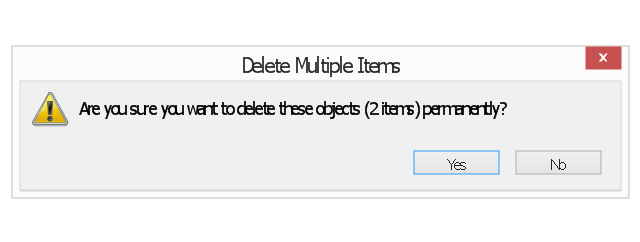
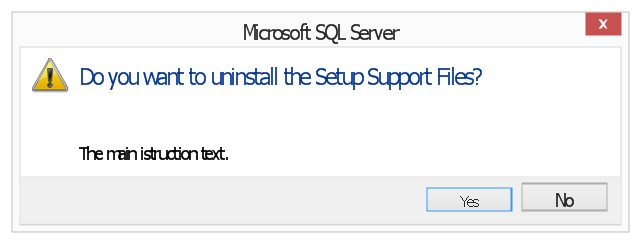
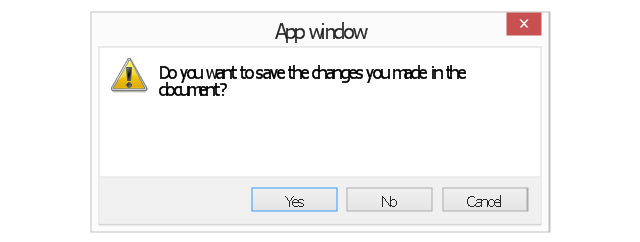
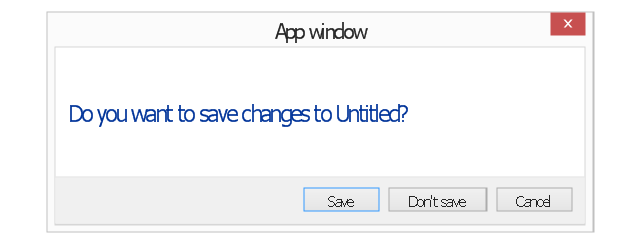
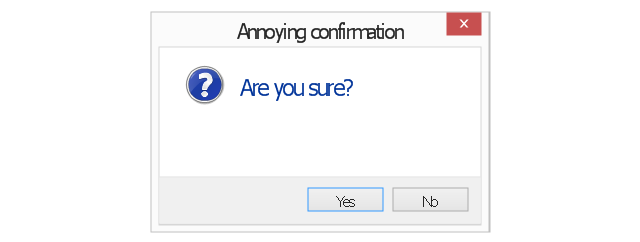
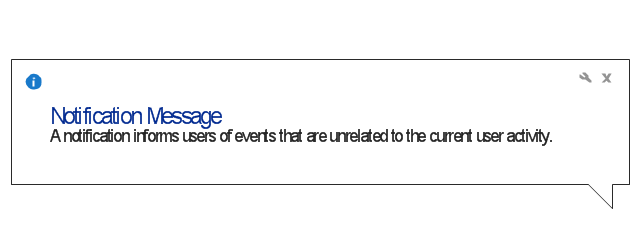
The vector stencils library "Messages" contains 10 Message dialog elements.
Use this notification dialog UI icon set to design graphic user interface (GUI) of your Windows 8 software application.
"A message dialog is an overlay UI element that provides a stable and contextual surface that is always modal and explicitly dismissed. Message dialogs appear at a consistent location on the screen. ...
Error messages that apply to the overall app context use message dialogs. ...
- Use message dialogs to convey urgent information that the user must see and acknowledge before continuing. ...
- Use message dialogs to present blocking questions that require the user's input. A blocking question is a question where the application cannot make a choice on the user's behalf, and cannot continue to fulfill it's value proposition to the user. A blocking question should present clear choices to the user. It is not a question that can be ignored or postponed.
- Use message dialogs to ask for explicit action from the user or to deliver a message that is important for the user to acknowledge. ...
- Use custom dialogs when the app or the system must invest a significant amount of time in the ensuing actions such that an accidental dismiss would be detrimental to the user's confidence.
- All dialogs should clearly identify the user's objective in the first line of the dialog's text (with or without a title).
- Don't use message dialogs when the app needs to confirm the user's intention for an action that the user has taken. Instead, a flyout is the appropriate surface. ...
- Don't use message dialogs for errors that are contextual to a specific place on the page, such as validation errors (in password fields, for example), use the app's canvas itself to show inline errors." [msdn.microsoft.com/ en-us/ library/ windows/ apps/ hh738363.aspx]
The notification dialogs example "Messages - Vector stencils library" was created using the ConceptDraw PRO diagramming and vector drawing software extended with the Windows 8 User Interface solution from the Software Development area of ConceptDraw Solution Park.
Process Flowchart
The main reason of using Process Flowchart or PFD is to show relations between major parts of the system. Process Flowcharts are used in process engineering and chemical industry where there is a requirement of depicting relationships between major components only and not include minor parts. Process Flowcharts for single unit or multiple units differ in their structure and implementation. ConceptDraw PRO is Professional business process mapping software for making Process flowcharts, Process flow diagram, Workflow diagram, flowcharts and technical illustrations for business documents and also comprehensive visio for mac application. Easier define and document basic work and data flows, financial, production and quality management processes to increase efficiency of your business with ConcepDraw PRO. Business process mapping software with Flowchart Maker ConceptDraw PRO includes extensive drawing tools, rich examples and templates, process flowchart symbols and shape libraries, smart connectors that allow you create the flowcharts of complex processes, process flow diagrams, procedures and information exchange. Process Flowchart Solution is project management workflow tools which is part ConceptDraw Project marketing project management software. Drawing charts, diagrams, and network layouts has long been the monopoly of Microsoft Visio, making Mac users to struggle when needing such visio alternative like visio for mac, it requires only to view features, make a minor edit to, or print a diagram or chart. Thankfully to MS Visio alternative like ConceptDraw PRO software, this is cross-platform charting and business process management tool, now visio alternative for making sort of visio diagram is not a problem anymore however many people still name it business process visio tools.
 Windows 10 User Interface
Windows 10 User Interface solution extends significantly ConceptDraw PRO v11 functionality with look-and-feel functions of GUI software and makes it a great assistant for Win10 designers, developers, and software engineers. This solution provides a wide s
How to Create a Pyramid Diagram
ConceptDraw Pyramid Diagram software allows drawing column charts using predesigned objects or drawing tools. In ConceptDraw Pyramid Diagram software you can find a complete set of column chart tools and objects.- Info Warning Error Icon
- Window elements - Vector stencils library | Gambar Icon Maximize
- Cross Functional Flowchart Shapes Stencil | Window elements ...
- Gambar Icon Ios
- Window elements - Vector stencils library | Network Icon | Network ...
- Icon Info Ui Example
- Window elements - Vector stencils library | Window elements ...
- MS Windows Vista user interface - Vector stencils library | MS ...
- Glyph icons - Vector stencils library | Windows 8 apps - Vector ...
- Windows 10 User Interface | ConceptDraw PRO Compatibility with ...

