Best Tool for Infographic Construction
ConceptDraw is a best data visualization tool that will allow everyone to create rich infographics and visualizations quickly and easily.HelpDesk
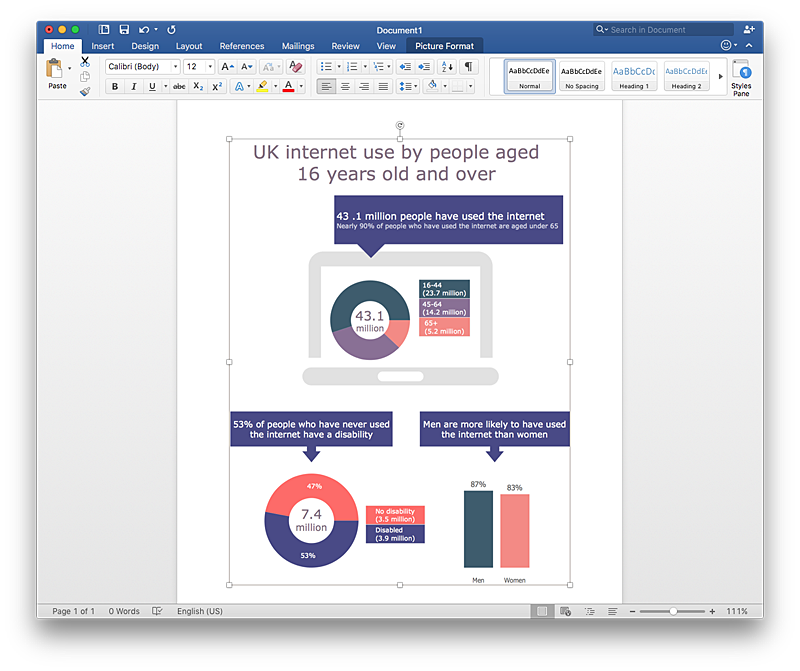
How to Add Data-driven Infographics to a MS Word Document Using ConceptDraw PRO
Infographics ae usually used as an effective way of showing a certain portion of information . There are a wide of range of subjects that can be represented in a such way. One of the most simple usage for the infographics, in business diagrams. Sales staff can use it as an effective method of sharing the sales results with the entire team and stakeholders. ConceptDraw Data-driven Infographics solution gives all the tools one need to present a certain type of data. ConceptDraw PRO allows you to easily create data-driven infographics and then insert them into a MS Word document.
 Circle-Spoke Diagrams
Examples of subject areas that are well suited to this approach are marketing, business, products promotion, process modeling, market, resource, time, and cost analysis. Circle-Spoke Diagrams are successfully used in presentations, conferences, management documents, magazines, reportages, reviews, reports, TV, and social media.
 Basic Circle-Spoke Diagrams
Basic circle-spoke diagrams are well suited for marketing, management documents, and presentations.
3 Circle Venn. Venn Diagram Example
This example shows the 3 Circle Venn Diagram. The Venn Diagrams visualize all possible logical intersections between several sets. On this example you can see the intersections of 3 sets. Venn Diagrams are widely used in mathematics, logic, statistics, marketing, sociology, etc.HelpDesk
How to Create Management Infographics Using ConceptDraw PRO
Management might want to communicate a basic workflow for each division of the company, visualise business strategy and decision processes, or display a certain business training concept. In this case, an infographic can be more text heavy, and use illustrations to establish a timeline, process, or step-by-step sequence of events. ConceptDraw PRO can be used as a tool for creating management infographics. It allows you to draw infographics quickly and easily using the special templates and vector stencils libraries. Infographics can be used to quickly communicate a message, to simplify the presentation of large amounts of data, to see data patterns and relationships, and to monitor changes in variables over time. It can contain bar graphs, pie charts, histograms, line charts, e.t.c.HelpDesk
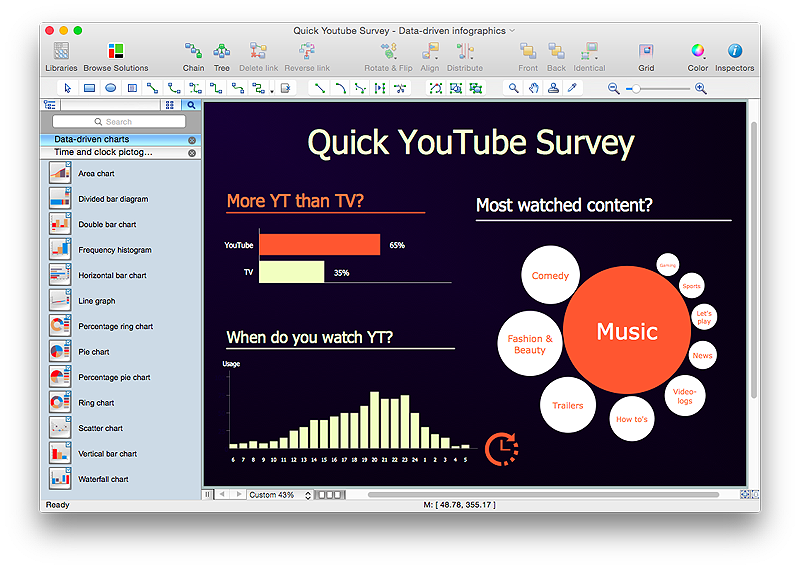
How to Create Data-driven Infographics
Data-driven infographics are used in wildly disparate areas of business and commerce. To make effective Data-driven infographics, it's useful to have a wide variety of graphical elements — icons, clipart, stencils, charts and graphs — to illustrate your diagram. ConceptDraw Data-driven Infographics solution provides all the tools you need to present data as described by this article — as well as the charts mentioned previously, you can find histograms, divided bar charts, ring charts, line graphs and area charts — meaning you can find the perfect medium for displaying a certain type of data. It allows you to draw data driven infographics quickly and easily using the special templates and vector stencils libraries.It can be used to quickly communicate a message, to simplify the presentation of large amounts of data, to see data patterns and relationships, and to monitor changes in variables over time.
 Spatial Infographics
Spatial infographics solution extends ConceptDraw PRO software with infographic samples, map templates and vector stencils libraries with design elements for drawing spatial information graphics.
HelpDesk
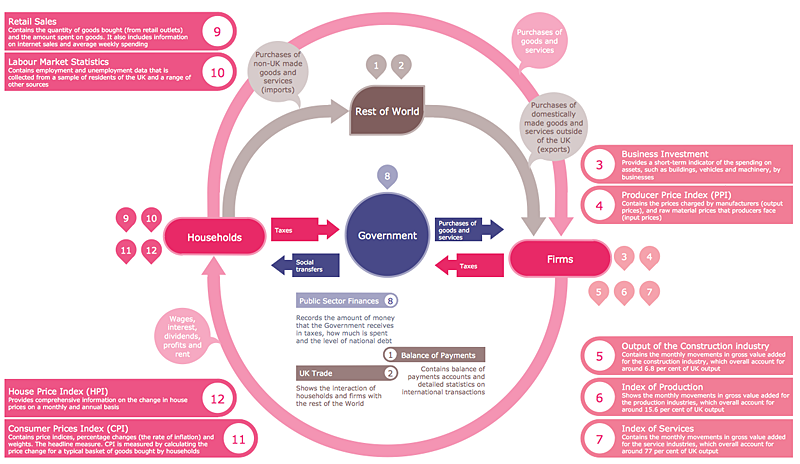
How to Draw a Circular Arrows Diagram Using ConceptDraw PRO
The cyclic recurrence is a fundamental property of multiple systems. The cycle is a process which consists from elements (phases, stages, stages) following each other. Many processes in astronomy, biology, chemistry, physics, mathematics, etc. have a cycle properties. It is also widely used in information technologies and marketing analysis. Graphical representation of cyclic processes can have many forms. It can be a circle, parabola, hyperbola, ellipse and others. A Circular Arrows Diagram is used as one of the statistical charts in the business, mass media and marketing. ConceptDraw PRO provides its users tools for making easy drawing Circular Arrows Diagrams.HelpDesk
How to Create Education Infographics
Education Infographics is used to display a lot of education-related information in a single, visually-appealing graphic. Infographics, created for education purposes can contain different illustrations, detailed charts, and data. ConceptDraw PRO can be used as a tool for creating education infographics. It allows you to draw infographics quickly and easily using the special templates and vector stencils libraries. Infographics can be used to quickly communicate a message, to simplify the presentation of large amounts of data, to see data patterns and relationships, and to monitor changes in variables over time. It can contain bar graphs, pie charts, histograms, line charts, e.t.c.HelpDesk
How to Create a Typography Infographic Using ConceptDraw PRO
Infographics are a good way to visually share knowledge , to communicate information and illustrate a message. Typography Infographics can help to present at a glance a large pack of complex information in a clear and vivid manner. Designers use the elements of typography Infographics to compose a graphic presentation of an information that is intended to depict the information behind the numbers in a creative and interesting visual way. Each infographic element is used to depict and explain an idea of the current portion of information. Each infographic element must inform its message clearly. ConceptDraw PRO provides the ability to design different kinds of typography infographics. You can use ConceptDraw Typography Infographics solution to create typography infographics effortlessly and quickly using the special set of vector stencils libraries.- 3 Circle Venn. Venn Diagram Example | Best Tool for Infographic ...
- Best Tool for Infographic Construction | 3 Circle Venn. Venn ...
- Circle -Spoke Diagrams | Social Determinants Of Health Infographic
- Circle Arrow For Infographic Ppt
- Circle Diagrams | Donut Chart Templates | Marketing Plan ...
- Infographic Maker | Visual Presentations Made Easy with ...
- Social determinants of health | Health Food | How to Create ...
- Marketing Diagrams | Basic Circle -Spoke Diagrams | Marketing ...
- Competitor Analysis | What are Infographic Area | Target market ...
- Circular diagrams - Vector stencils library | What are Infographic ...
- Marketing Plan Infographic | How to Change the Form and Color of a ...
- Circular Infographics
- Circle Bullets
- Marketing Plan Infographic | Internet Marketing Infographic | 3-4 ...
- Circle Text Blocks
- USA Maps | Basic Area Charts | Circle -Spoke Diagrams | Population ...
- Best Tool for Infographic Construction | Organizational Structure ...
- Infographic Donut Chart
- Arrow Infographic
- Marketing infographics - Market research | Tool for Workgroup ...


