 What are Infographic Area
Solutions of the area What is Infographics from ConceptDraw Solution Park collect templates, samples and vector stencils libraries with design elements for the drawing information graphics.
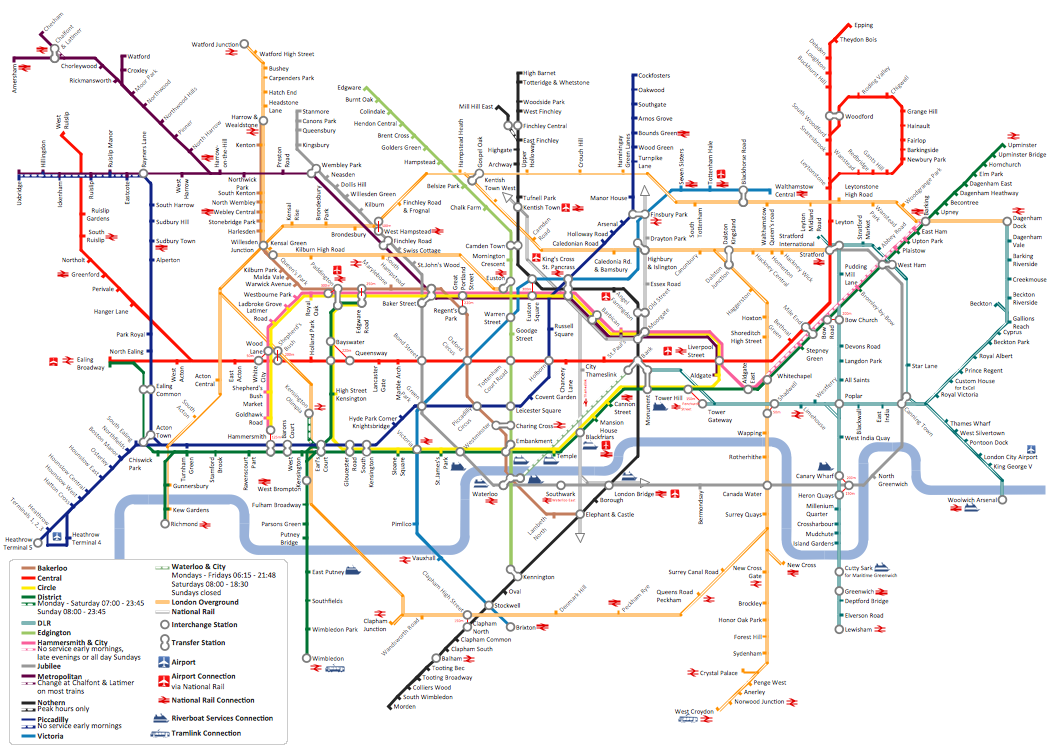
How to draw Metro Map style infographics? (London)
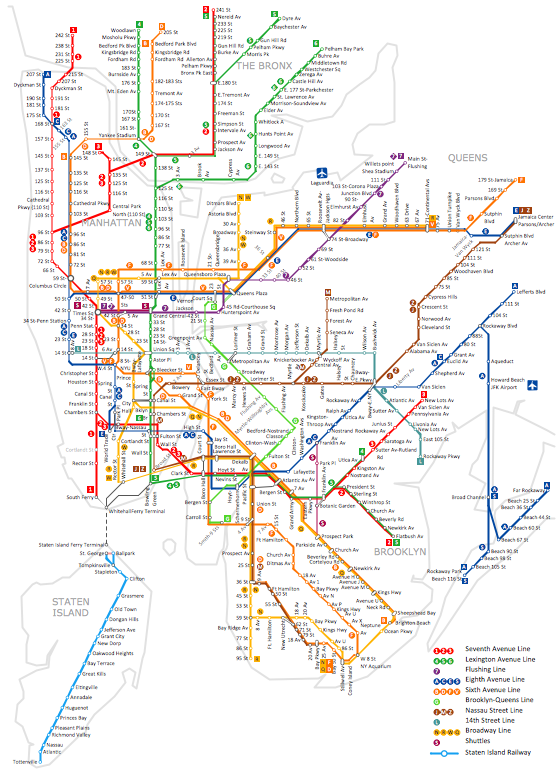
Tool to draw Metro Map styled inforgraphics. London Tube map sample.Infographic software: the sample of New York City Subway map
Tool to draw Metro Map styled inforgraphics. New York City Subway map sample.
 Cross-Functional Flowcharts
Cross-functional flowcharts are powerful and useful tool for visualizing and analyzing complex business processes which requires involvement of multiple people, teams or even departments. They let clearly represent a sequence of the process steps, the order of operations, relationships between processes and responsible functional units (such as departments or positions).
How to draw Metro Map style infographics? Moscow, New York, Los Angeles, London
The solution handles designs of any complexity, and the comprehensive library covers all key aspects of a transportation system. To further enhance your map design, there is the option to embed links, that can display station images or other relevant, important information. We have also included a set of samples in the solution, that show the possible real-world application — complex tube systems including the London Tube and New York City Subway show the level of detail possible when using the Metro Map Solution.
 Flowcharts
The Flowcharts Solution for ConceptDraw PRO v10 is a comprehensive set of examples and samples in several different color themes for professionals that need to graphically represent a process. Solution value is added by basic flow chart template and shapes' library of Flowchart notation. ConceptDraw PRO flow chart creator lets one depict a processes of any complexity and length, as well design of the flowchart either vertically or horizontally.
 PM Teams
This solution extends ConceptDraw Office 2.0 products with a single information space for messaging to teams.
 Accounting Flowcharts
Accounting Flowcharts solution extends ConceptDraw PRO software with templates, samples and library of vector stencils for drawing the accounting flow charts.
 Composition Dashboard
Composition dashboard solution extends ConceptDraw PRO software with templates, samples and vector stencils library with charts and indicators for drawing visual dashboards showing data composition.
- How to draw Metro Map style infographics ? Moscow, New York, Los ...
- Excellent Examples of Infographic Maps | Spatial Infographics | PM ...
- Infographic design elements, software tools Subway and Metro style ...
- Subway infographic design elements - software tools
- Spatial Infographics | What is Infographics Area | ConceptDraw ...
- Spatial Dashboard | Spatial Infographics | Spatial Infographics |
- Metro Map | How to draw Metro Map style infographics ? Moscow ...
- Superb Examples of Infographic Maps | Transportation Infographics ...
- Infographic design elements, software tools Subway and Metro style ...
- Metro Map | How to draw Metro Map style infographics ? Moscow ...
- Maps | How to draw Metro Map style infographics ? (London) | How ...
- Spatial infographics Design Elements: Location Map
- How to draw Metro Map style infographics ? Moscow, New York, Los
- Metro Map | How to draw Metro Map style infographics ? (London ...
- How to draw Metro Map style infographics ? Moscow, New York, Los ...
- Concept maps with ConceptDraw PRO | Education | Universal ...
- Continent Maps | Spatial infographics Design Elements: Continental ...
- How to draw Metro Map style infographics ? (London) | How to draw ...
- Best Vector Drawing Application for Mac OS X | Vector graphics ...
- How to draw Metro Map style infographics ? Moscow, New York, Los ...


