This site uses cookies. By continuing to browse the ConceptDraw site you are agreeing to our Use of Site Cookies.

Map Infographic Creator

Follow samples and map templates to create nfographic maps. It's super-easy!

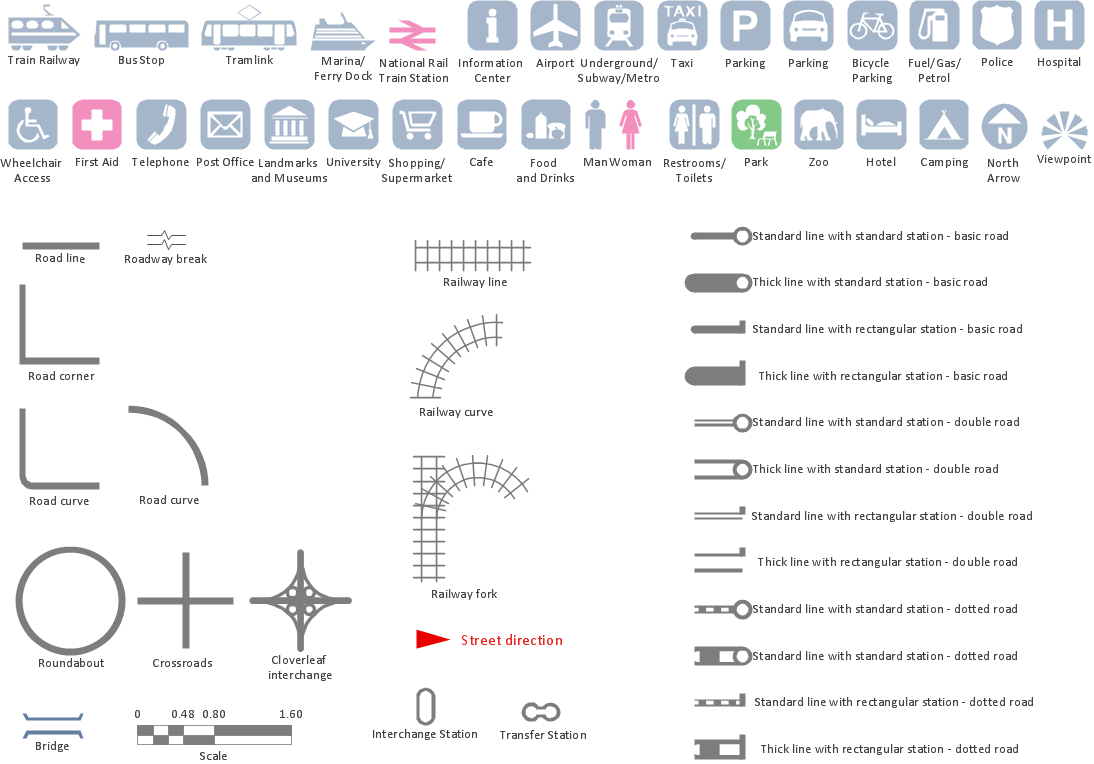
Subway infographic design elements - software tools

Subway infographic design elements of MetroMap and ConceptDraw software tools.

Map Infographic Maker

Take inspiration with ConceptDraw to visualise your maps and make eye-catching infographics.

Infographic Maker

Infographic is a visual way of representing various information, data, knowledge in statistics, geography, journalism, education, and much more areas. ConceptDraw DIAGRAM supplied with Pictorial Infographics Solution from the “Infographics” Area, provides a set of powerful pictorial infographics tools. Thanks to them it is the best Infographic Maker.

Infographic Making Software

Using the drawing tools of ConceptDraw DIAGRAM infographic making software you can make stunning visuals in an engaging and pleasing manner quickly and easily. Identify your target audience and include the relevant content to your infographic to create appealing complex or simple infographics targeted directly to your audience. You can create an infographic from scratch or use the pre-made samples included in the Marketing Infographics solution or other solutions from the Business Infographics package. They also can become your inspiration.

Infographic Generator

ConceptDraw DIAGRAM extended with Typography Infographics Solution from the “Infographics” Area is the best Infographic Generator. Make sure in it right now! Typography Infographics Solution offers you the best numerous collection of predesigned infographics examples and 9 libraries with large quantity of ready-to-use vector stencils that will help you design your own Typography Infographics of any complexity in minutes..

Infographic Software

ConceptDraw DIAGRAM extended with Pictorial Infographics Solution from the “Infographics” Area is a powerful Infographic Software. Make sure in it right now!

Good Flow Chart app for Mac

The ConceptDraw DIAGRAM is a good flow chart app for Mac. Numerous vector stencils, samples and templates created by designers allows you to draw any type of flowchart.

Spatial infographics Design Elements: Transport Map

Do you like infographics and data visualization? Creating infographics is super-easy with ConceptDraw.

Infographic Tools

ConceptDraw DIAGRAM diagramming and vector drawing software offers the best infographic tools - Data-driven Infographics Solution from the “Infographics” Area of ConceptDraw Solution Park.

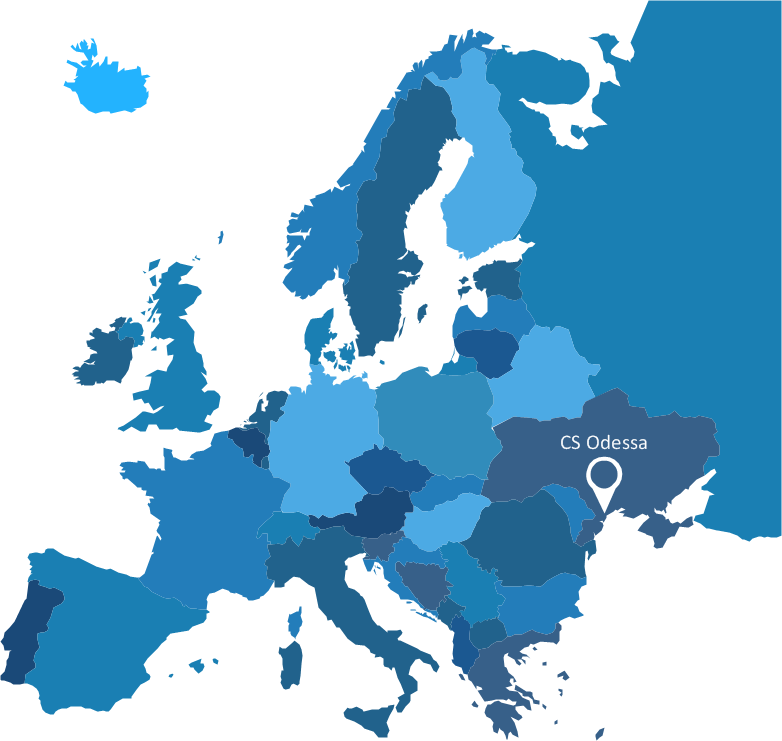
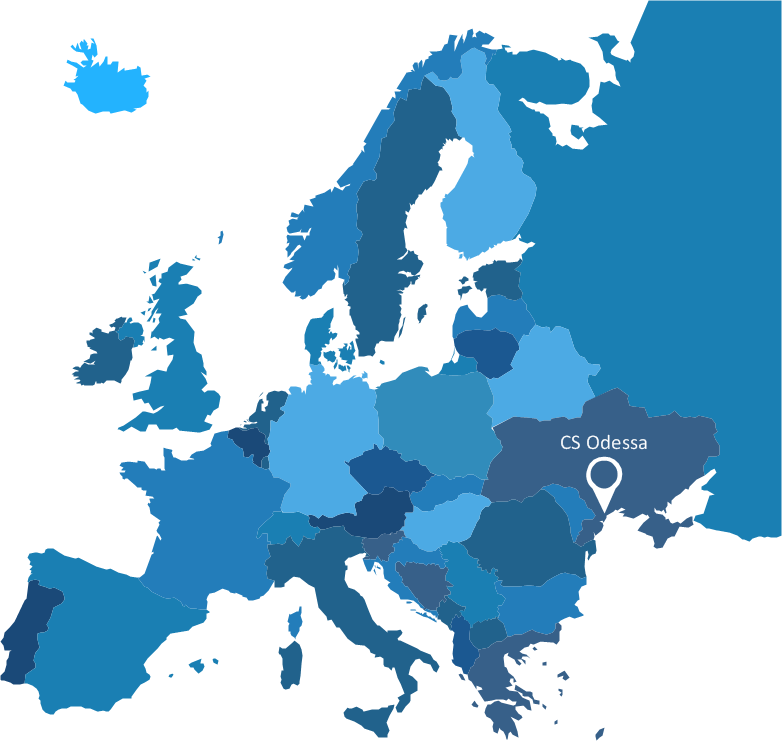
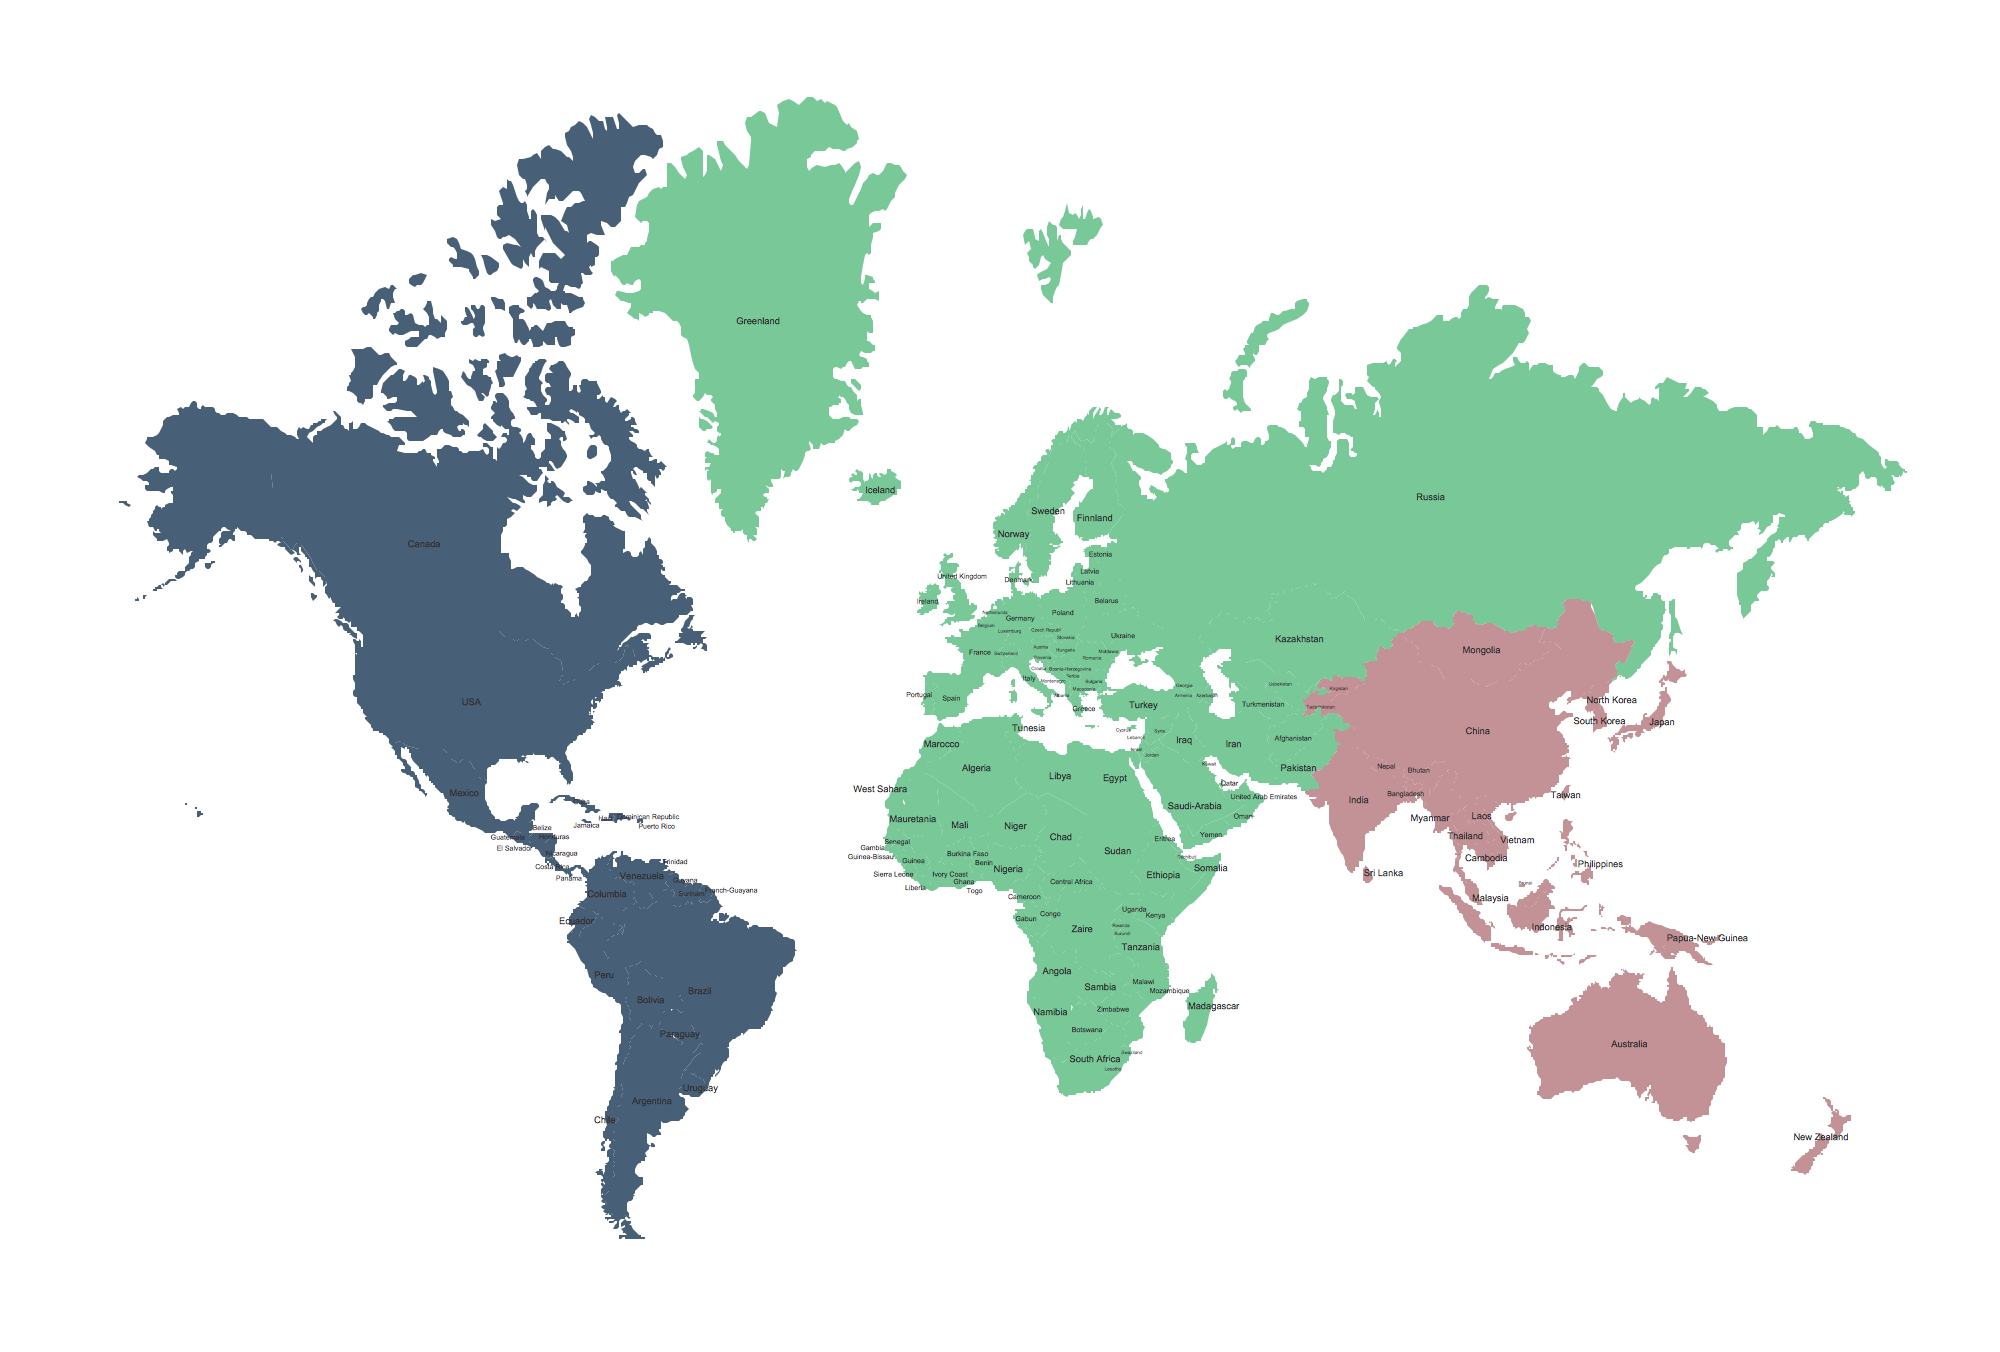
Spatial infographics Design Elements: Continental Map

ConceptDraw DIAGRAM is a software for making infographics illustrations. You can work with various components to build really impressive and easy-to-understand infographics design.

Infographic software: the sample of New York City Subway map

Tool to draw Metro Map styled inforgraphics. New York City Subway map sample.

How to draw Metro Map style infographics? (Los Angeles)

Tool to draw Metro Map styled inforgraphics. Los Angeles Metro Rail and Liner sample. This is a one-click tool to add stations to the map. It lets you control the direction in which you create new stations, change lengths, and add text labels and icons. It contains Lines, Stations, and Landmarks objects.

Selecting & Creating Flowcharts

ConceptDraw Flowcharts visualize a process or algorithm of program as step/operation blocks of various shapes connected with arrowed lines showed the process flow direction. They are used to visualize business or technical processes and software algorithms.

Marketing Plan Infographic

You need design the Marketing Plan Infographic and dream to find the useful tools to draw it easier, quickly and effectively? ConceptDraw DIAGRAM offers the unique Marketing Infographics Solution from the Business Infographics Area that will help you!

Winter Sports. Using Winter Sports Design Elements Producing Infographics

The Winter Sports solution from Sport Area of ConceptDraw Solution Park contains winter sports pictogram you may use illustrating any kind of material about Olympic Games or any other sport competitions.

Tools to Create Your Own Infographics

Over the past few centuries, data visualization has evolved so much that we use it every day in all areas of our lives. Many believe that infographic is an effective tool of storytelling, as well as analytics, and that it is able to overcome most of the language and educational barriers. Understanding the mechanisms of human perception will help you to understand how abstract forms and colors used in data visualization can transmit information more efficient than long paragraphs of text.

How To Implement Collaborative Project Management

Collaborative Project Management via Skype is an ideal tool for project teams who need to master a growing project complexity.

Map Software

Create maps, flags, and more with ConceptDraw