HelpDesk
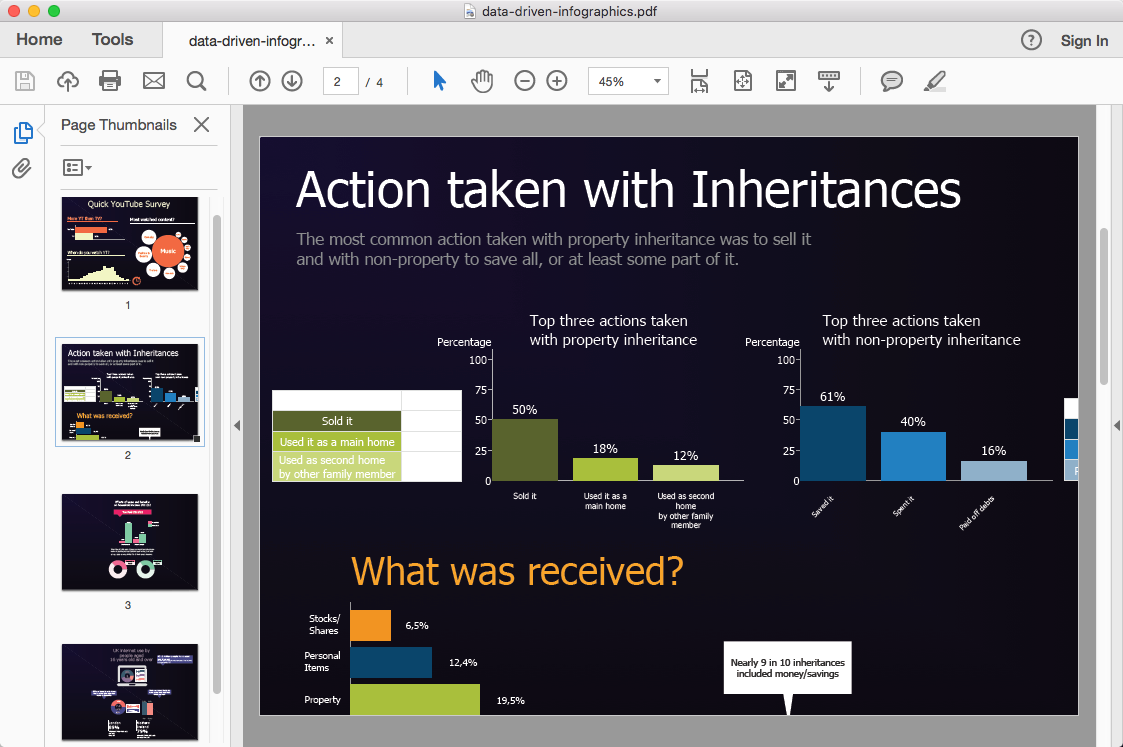
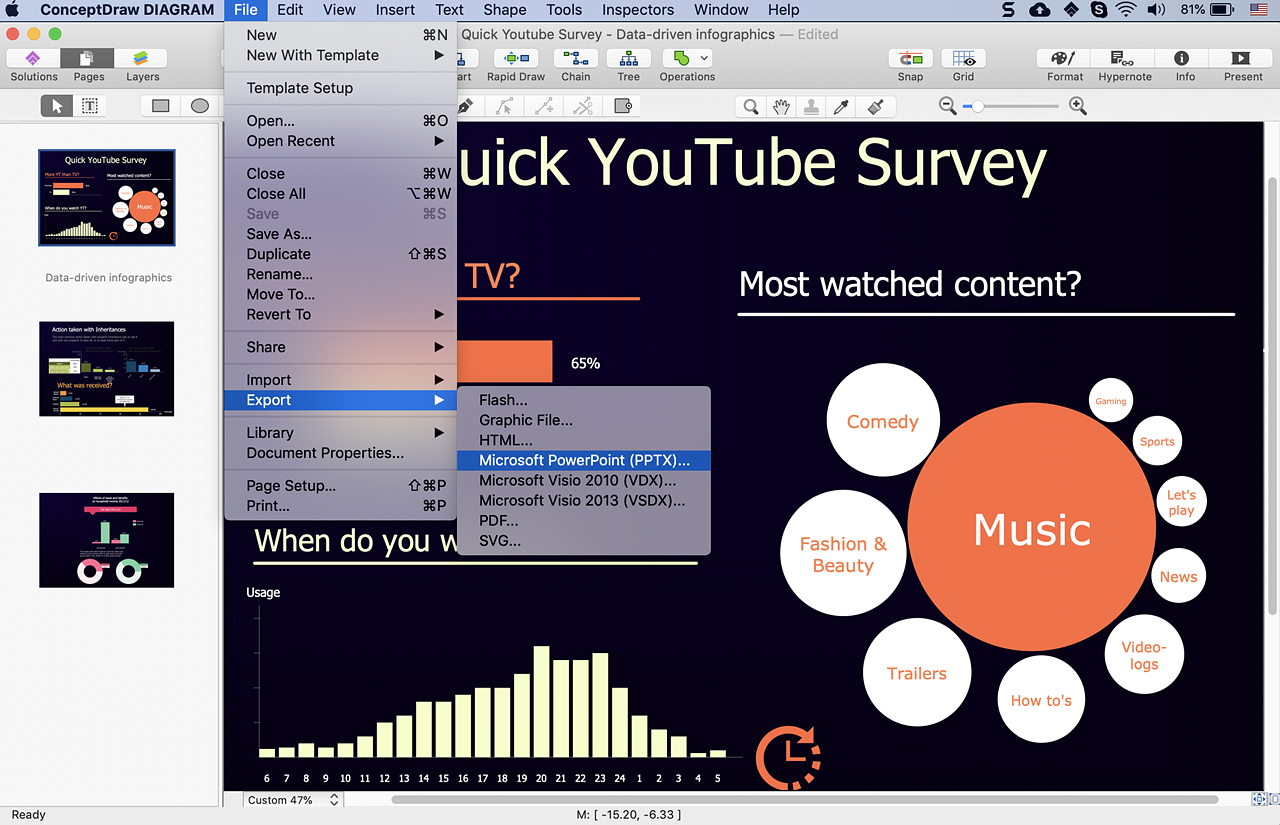
How To Convert Data-driven Infographics to Adobe PDF
ConceptDraw PRO allows you to easy share your business documentation between different computers with different operating systems and applications using it's export capabilities.You can get clear infographics in pdf format and avoid any problems while communicating it with stakeholders.HelpDesk
How to Create a Typography Infographic Using ConceptDraw PRO
Infographics are a good way to visually share knowledge , to communicate information and illustrate a message. Typography Infographics can help to present at a glance a large pack of complex information in a clear and vivid manner. Designers use the elements of typography Infographics to compose a graphic presentation of an information that is intended to depict the information behind the numbers in a creative and interesting visual way. Each infographic element is used to depict and explain an idea of the current portion of information. Each infographic element must inform its message clearly. ConceptDraw PRO provides the ability to design different kinds of typography infographics. You can use ConceptDraw Typography Infographics solution to create typography infographics effortlessly and quickly using the special set of vector stencils libraries.HelpDesk
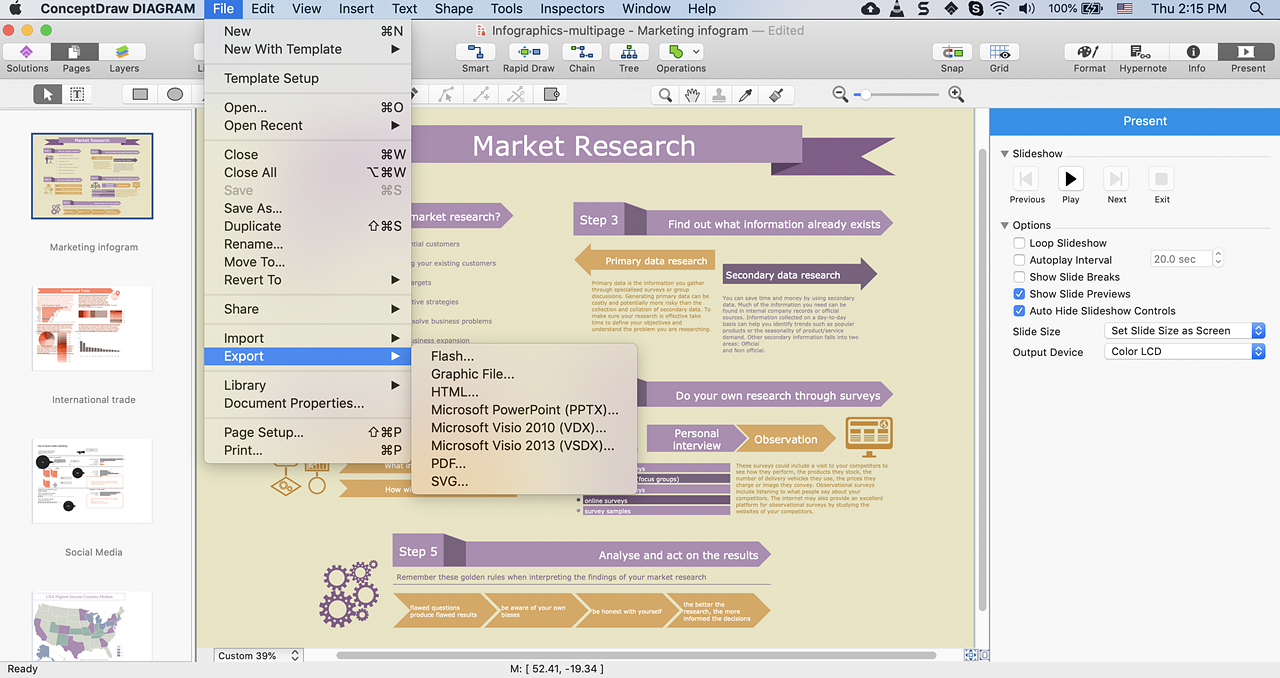
How to Use Infographic in Presentations, Documents, and Publications
Exporting, embedding, and pasting as a picture are the ways you can use to add ConceptDraw drawings to presentations, documents, and publications.HelpDesk
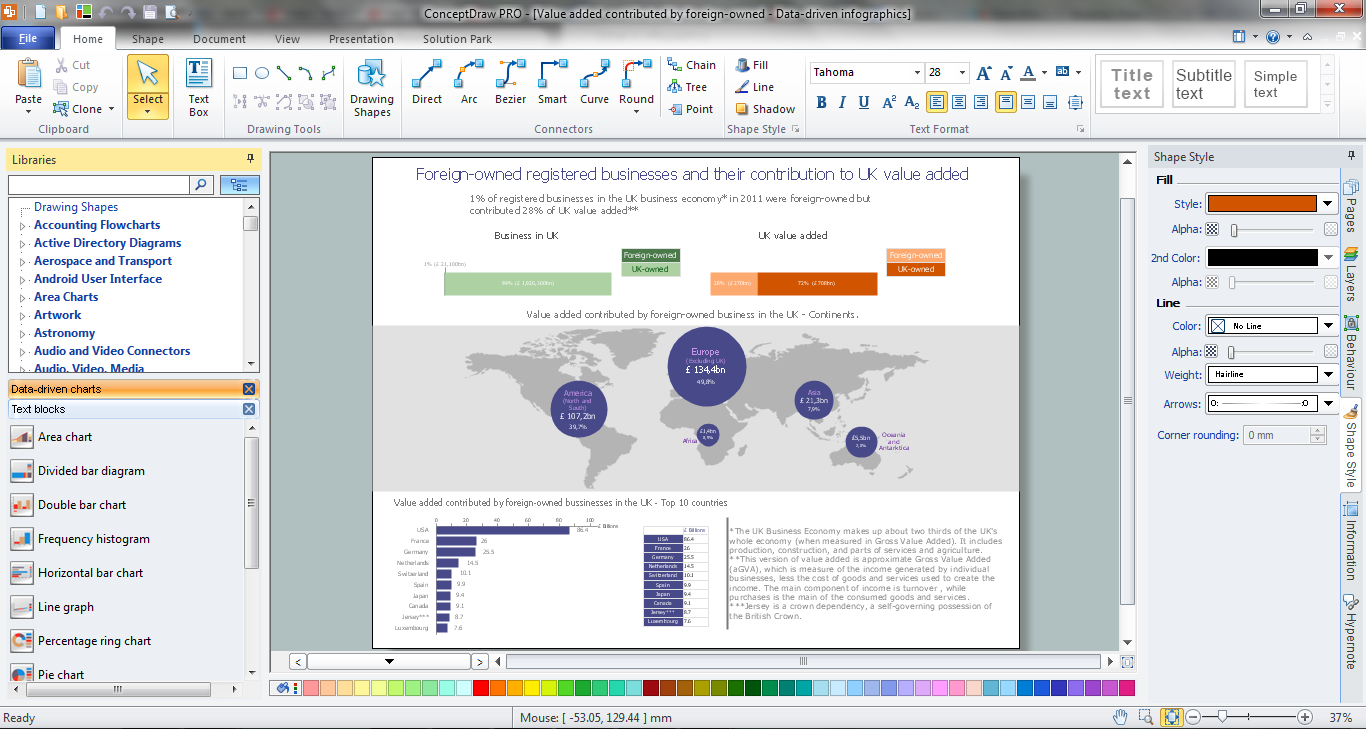
How to Create Data-driven Infographics
Data-driven infographics are used in wildly disparate areas of business and commerce. To make effective Data-driven infographics, it's useful to have a wide variety of graphical elements — icons, clipart, stencils, charts and graphs — to illustrate your diagram. ConceptDraw Data-driven Infographics solution provides all the tools you need to present data as described by this article — as well as the charts mentioned previously, you can find histograms, divided bar charts, ring charts, line graphs and area charts — meaning you can find the perfect medium for displaying a certain type of data. It allows you to draw data driven infographics quickly and easily using the special templates and vector stencils libraries.It can be used to quickly communicate a message, to simplify the presentation of large amounts of data, to see data patterns and relationships, and to monitor changes in variables over time.Infographic Tools
ConceptDraw PRO diagramming and vector drawing software offers the best infographic tools - Data-driven Infographics Solution from the “Infographics” Area of ConceptDraw Solution Park.HelpDesk
How to Create Education Infographics
Education Infographics is used to display a lot of education-related information in a single, visually-appealing graphic. Infographics, created for education purposes can contain different illustrations, detailed charts, and data. ConceptDraw PRO can be used as a tool for creating education infographics. It allows you to draw infographics quickly and easily using the special templates and vector stencils libraries. Infographics can be used to quickly communicate a message, to simplify the presentation of large amounts of data, to see data patterns and relationships, and to monitor changes in variables over time. It can contain bar graphs, pie charts, histograms, line charts, e.t.c.HelpDesk
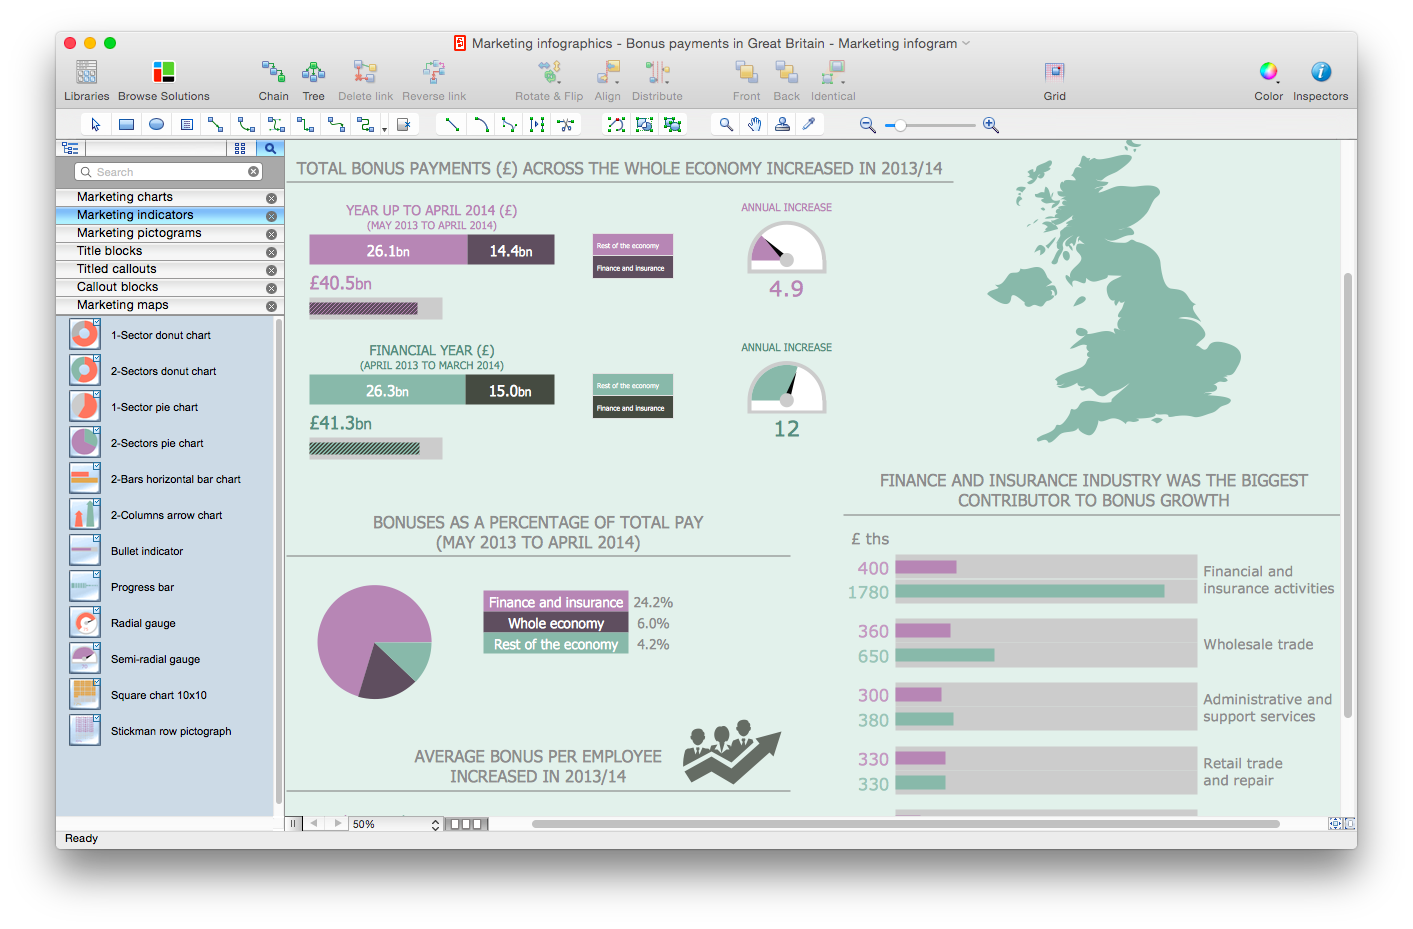
How to Create Marketing Infographics
Marketing Infographics are used to quickly communicate a marketing message, to simplify the marketing presentation of large amounts of data, to see data patterns and relationships, and to monitor changes in variables over time. It can contain bar graphs, pie charts, histograms, line charts, e.t.c. Marketing infographics display a lot of information in a single, visually-appealing picture. ConceptDraw PRO can be used as a tool for creating marketing infographics. It allows you to draw marketing infographics quickly and easily using the special templates and vector stencils libraries.HelpDesk
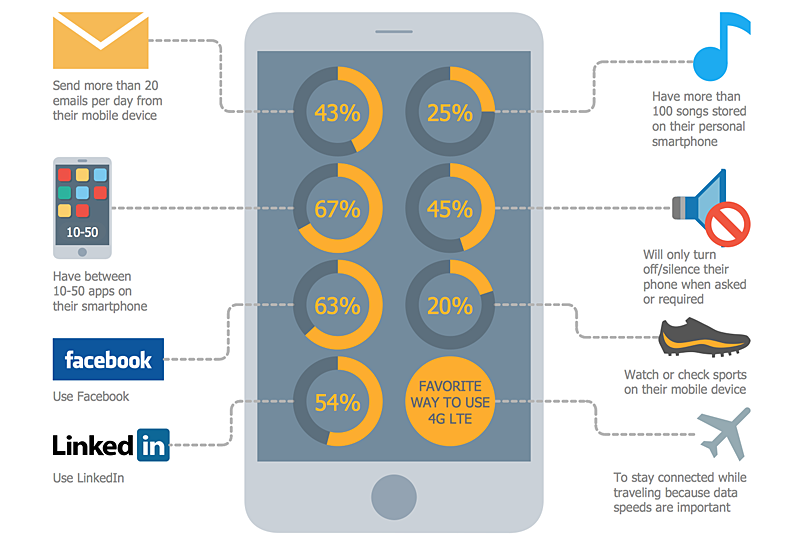
How to Create Digital Media Infographics Using ConceptDraw PRO
The information and communicating flow, surrounding all of us, is constantly growing. Our inquiries on new digital technologies and new gadgets also grow. Video, audio, media servises move ahead rapidly and our being is already impossible without them. Internet, email, mobile devices, etc. pass into significant piece of a daily life. Using the ConceptDraw Audio, Video, Media solution, you can make professional-looking schematics, dramatic infographics and presentations related to digital mobile, audio and video devices.HelpDesk
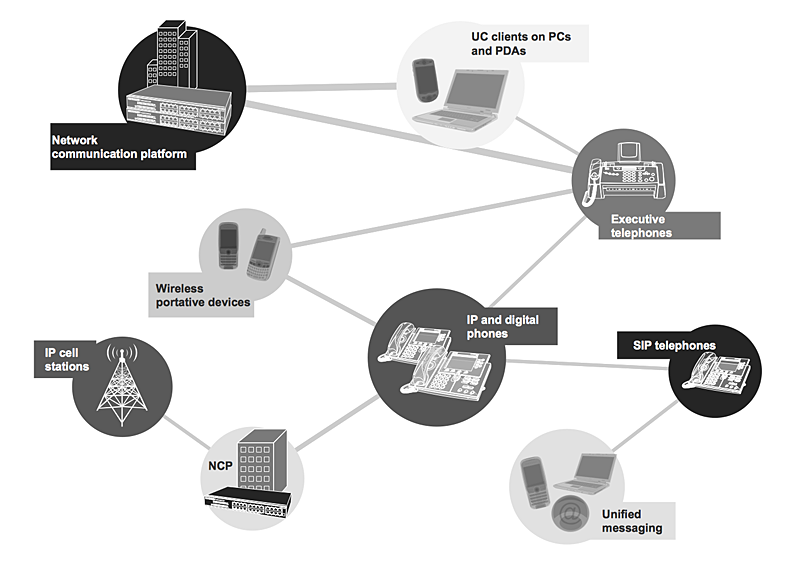
How to Create Computers and Communications Infographics Using ConceptDraw PRO
Design professional, good-looking infographics, presentations and schematics related to computers and communications. ConceptDraw PRO and its Computers and Communications solution supply your artworks with a huge number of vector clipart of electronic devices, computers and symbols of electronic communication technologies. Finally you can effortlessly convert your artworks into PowerPoint presentation, Adobe PDF file, HTML, or any graphic formats.- How to draw Metro Map style infographics ? (New York) | Subway ...
- New Education Infographics Solution Now Available for ...
- Audio format developments | Digital audio | How to Create Digital ...
- How To Create a MS Visio Data-driven Infographics Using ...
- People Infographic Clipart
- How to Add Data-driven Infographics to a MS Word Document Using ...
- Professions - Vector stencils library | Spatial infographics Design ...
- London Metro Map Vector Files
- Design Pictorial Infographics . Design Infographics | Medicine and ...
- Best Tool for Infographic Construction | ConceptDraw PRO ...
