Marketing Plan Infographic
You need design the Marketing Plan Infographic and dream to find the useful tools to draw it easier, quickly and effectively? ConceptDraw PRO offers the unique Marketing Infographics Solution from the Business Infographics Area that will help you!Typography Infographic Examples
ConceptDraw PRO extended with Typography Infographics Solution from the “What are Infographics” Area is a powerful infographic software that offers you variety of infographics examples. Use of predesigned examples as the base for your own Typography Infographics is a timesaving and useful way. Simply open the desired example, change for your needs and then successfully use it in any field of your activity.Export from ConceptDraw PRO Document to a Graphic File
Now it’s easy to share your visual documents with other people in a form most convenient for them. ConceptDraw PRO can save your drawings and diagrams in a number of highly useful formats, including graphic files. You can save your drawing as a .PNG, .JPG, or other graphic format file.
Spatial infographics Design Elements: Location Map
Infographic Design Elements for visually present various geographically distributed information.Geo Map - Asia - Papua New Guinea
Papua New Guinea, officially named the Independent State of Papua New Guinea, is a country in Oceania that occupies the eastern half of the island of New Guinea (the western portion of the island is a part of the Indonesian provinces of Papua and West Papua) and numerous offshore islands. The vector stencils library Papua New Guinea contains contours for ConceptDraw PRO diagramming and vector drawing software. This library is contained in the Continent Maps solution from Maps area of ConceptDraw Solution Park.Spatial infographics Design Elements: Transport Map
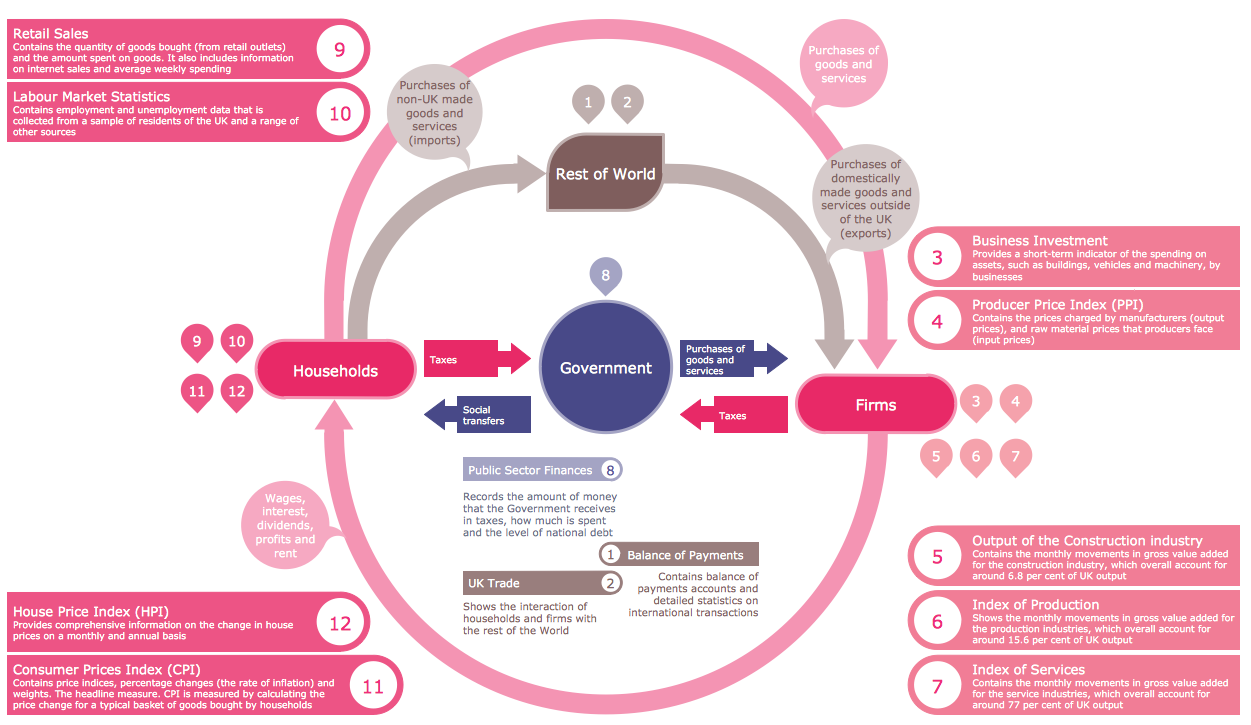
Do you like infographics and data visualization? Creating infographics is super-easy with ConceptDraw.Best Tool for Infographic Construction
ConceptDraw is a best data visualization tool that will allow everyone to create rich infographics and visualizations quickly and easily.Winter Sports Vector Clipart. Medal Map. Spatial Infographics
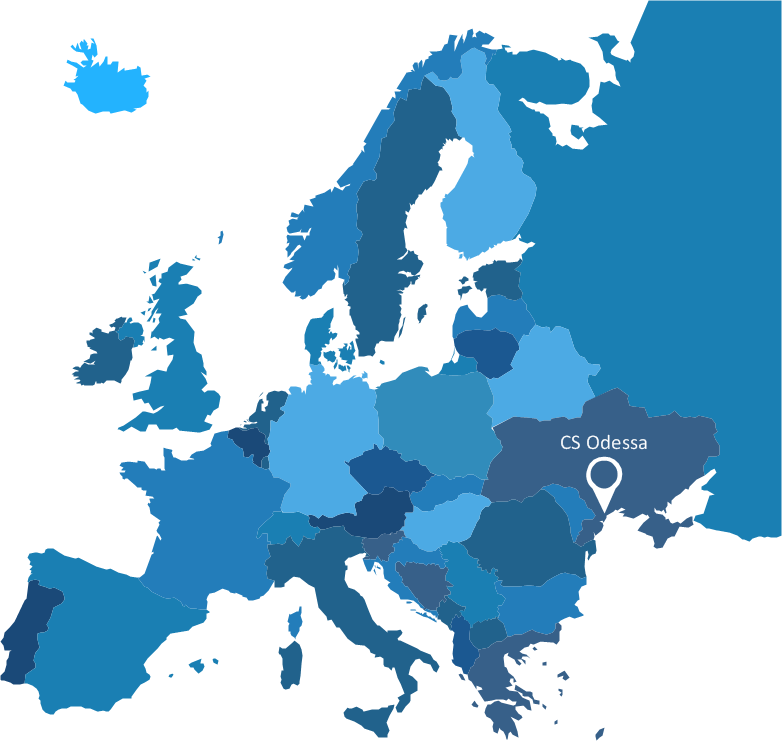
Tracking Olympic results in visual format is the most modern way to deliver statistics to a broad audience. This is a good example of an illustrated table you may easily modify, print, or publish on web from ConceptDraw Winter Sports solution .Spatial infographics Design Elements: Continental Map
ConceptDraw PRO is a software for making infographics illustrations. You can work with various components to build really impressive and easy-to-understand infographics design.Content Marketing Infographics
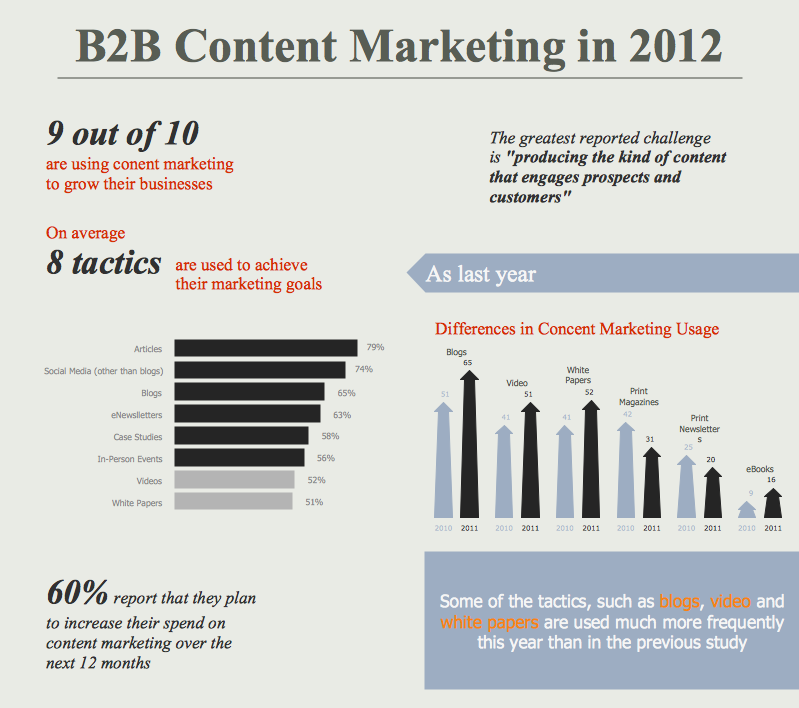
The popularity of visual content marketing grows day by day. So now simple and convenient designing of professional looking Content Marketing Infographics becomes increasingly actual. For achievement this goal ConceptDraw PRO software offers the Marketing Infographics Solution from the Business Infographics Area.Infographic Generator
ConceptDraw PRO extended with Typography Infographics Solution from the “What are Infographics” Area is the best Infographic Generator. Make sure in it right now! Typography Infographics Solution offers you the best numerous collection of predesigned infographics examples and 9 libraries with large quantity of ready-to-use vector stencils that will help you design your own Typography Infographics of any complexity in minutes..Sport pictograms. Olympic Games
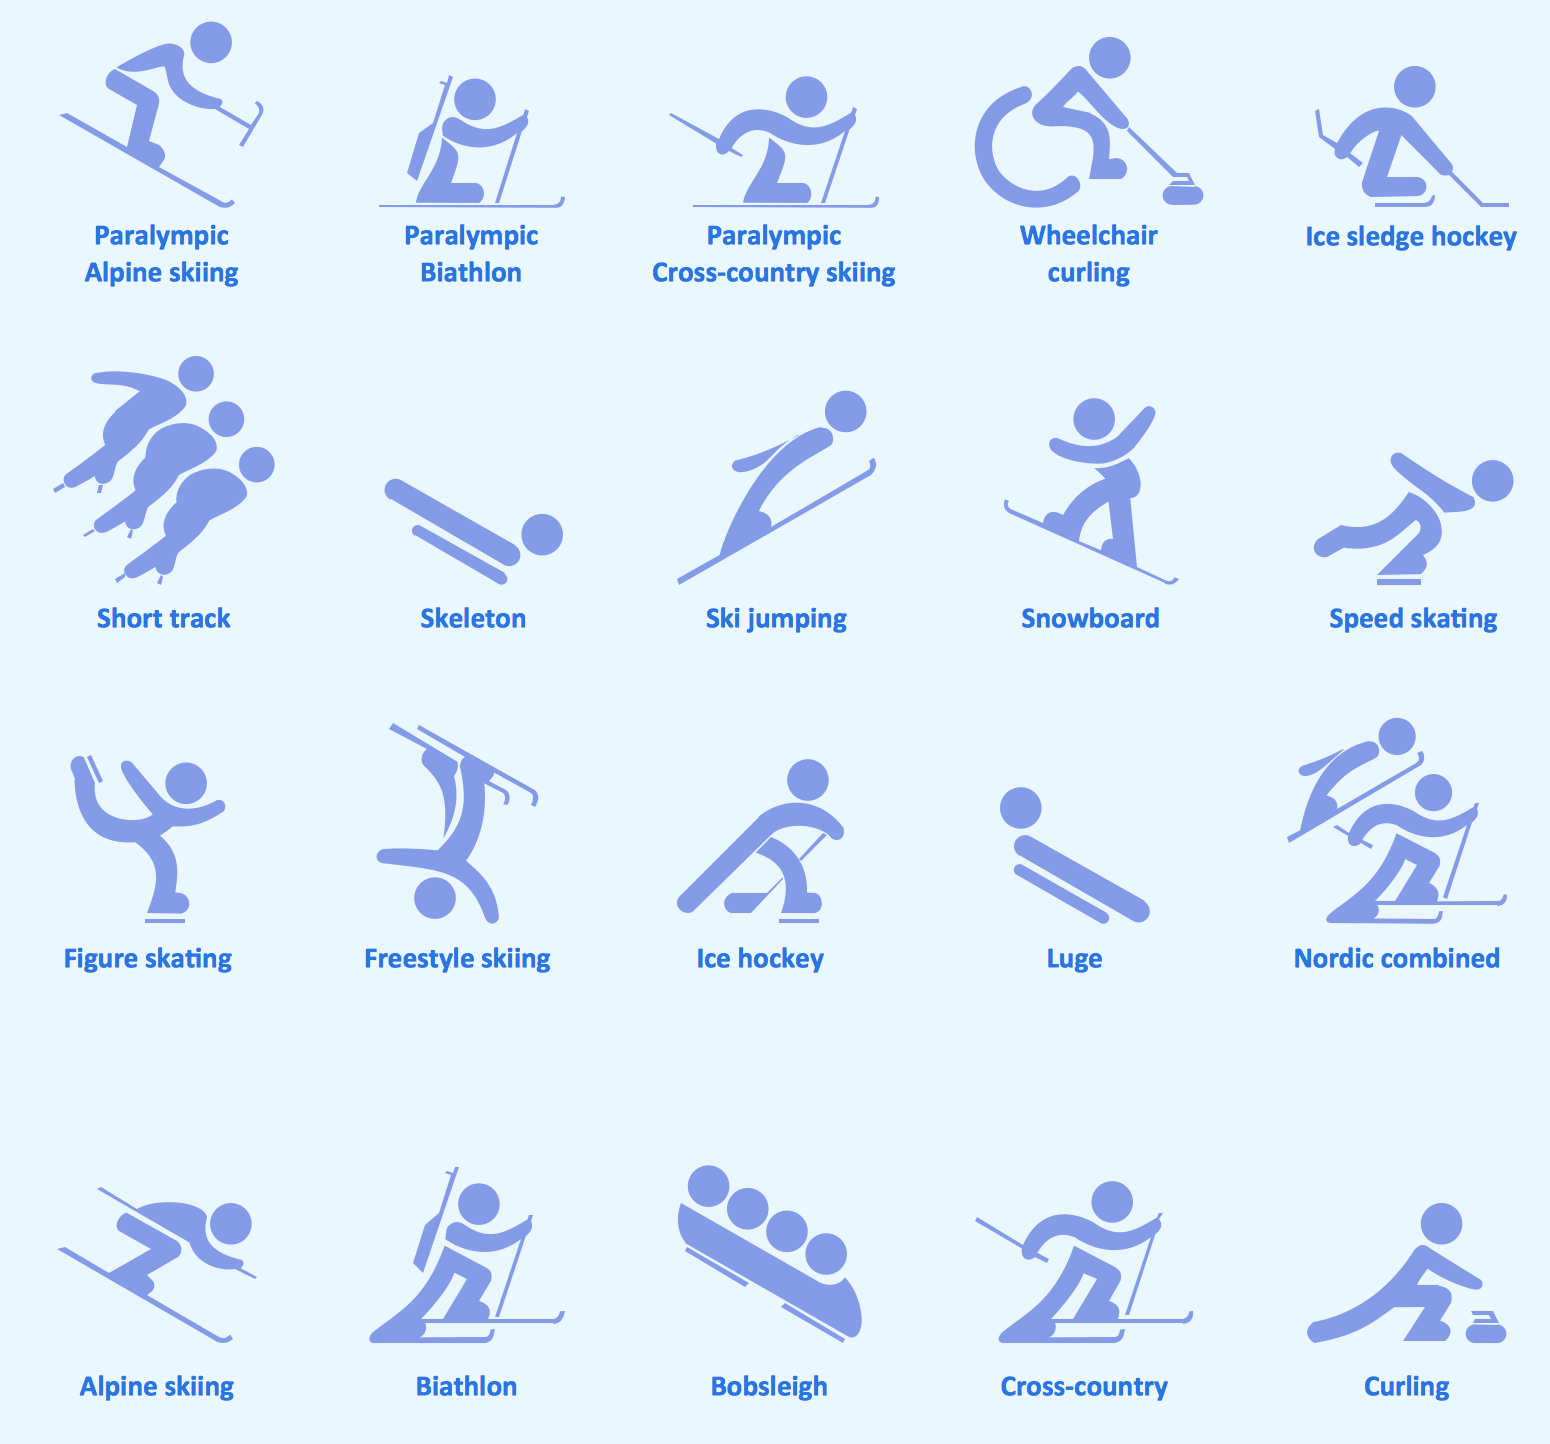
The Winter Sports solution from Sport Area of ConceptDraw Solution Park contains winter sports pictograms you may use illustrating any kind of material about Olympic Games or any other sport competitions.How to draw Metro Map style infographics? Moscow, New York, Los Angeles, London
The solution handles designs of any complexity, and the comprehensive library covers all key aspects of a transportation system. To further enhance your map design, there is the option to embed links, that can display station images or other relevant, important information. We have also included a set of samples in the solution, that show the possible real-world application — complex tube systems including the London Tube and New York City Subway show the level of detail possible when using the Metro Map Solution.Design Pictorial Infographics. Design Infographics
In the course of recent decades data visualization went through significant development and has become an indispensable tool of journalism, business intelligence and science. The way visual information may be conveyed is not limited simply to static or dynamic representation, it can also be interactive. Infographics can be conditionally divided into several general levels. Primarily, this is level of visualization of information, its interpretation and association on any ground. Second level can be defined as a visualization of knowledge, depiction of thoughts and ideas in the form of images or diagrams. Finally, the level of data visualization, which processes data arrays in charts, enabling the information to be more clearly perceived. You can also identify the main approaches to the creation of infographics: exploratory and narrative. Exploratory method insists on minimalist design in favor of data precision without unnecessary details and is common for scientific researches and anaMap Infographic Design
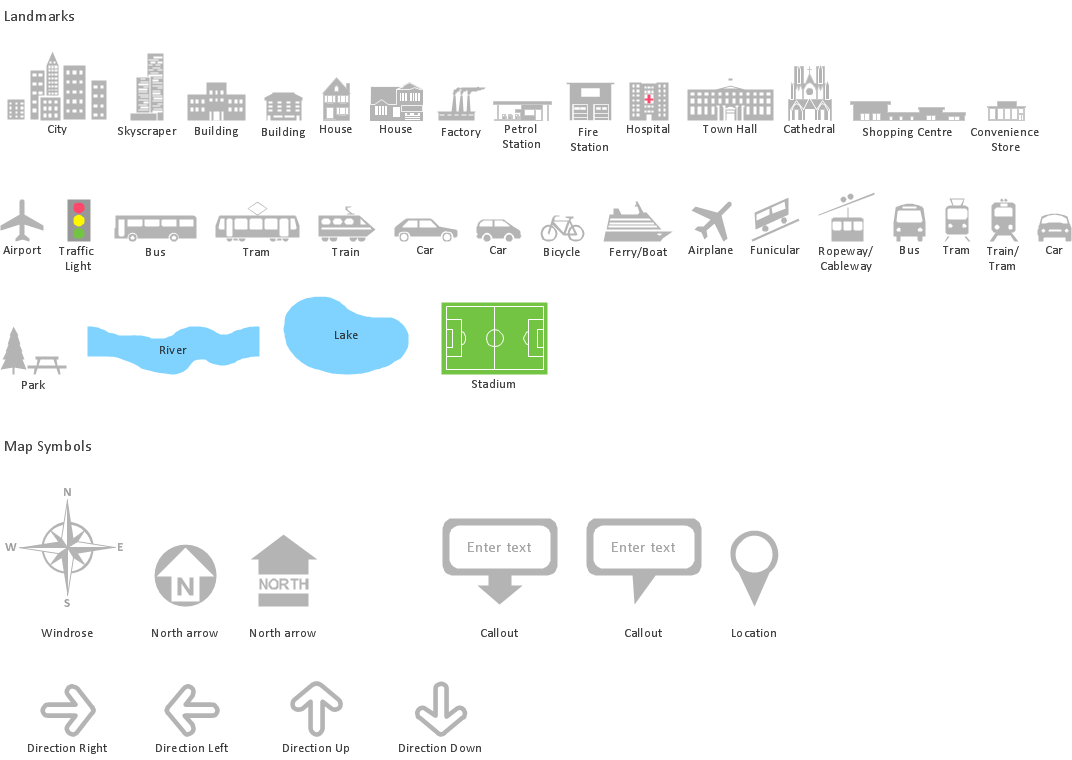
ConceptDraw collection of vector elements for infographics design.- Business Infographic Vector Png
- General Knowledge Vector Png
- Marketing Plan Infographic | Marketing - Vector stencils library ...
- Medicine Vector Png Image
- Communication Skills Vector Png
- Person Infographic Icon Png
- Marketing Plan Infographic | Presentation design elements - Vector ...
- Travel Vectors Png
- Superb Examples of Infographic Maps | Infographic Maker ...
- Landmarks - Vector stencils library | Process Flow Chart | Spatial ...
- Shopping Infographic Png
- Infographic Templates For Bullets
- Transportation Infographics | Design elements - Telecom | Transport ...
- People pictograms - Vector stencils library | Business people ...
- Investment Vector Png For Ppt
- Sport Whistle Infographic Png
- Logo Medical Vector Png Hd
- Education Related Vectors Png
- Tourism Logo Vector Png
- Business people - Vector stencils library | Process Flowchart | Boss ...

