HelpDesk
Flowchart Software Free Download
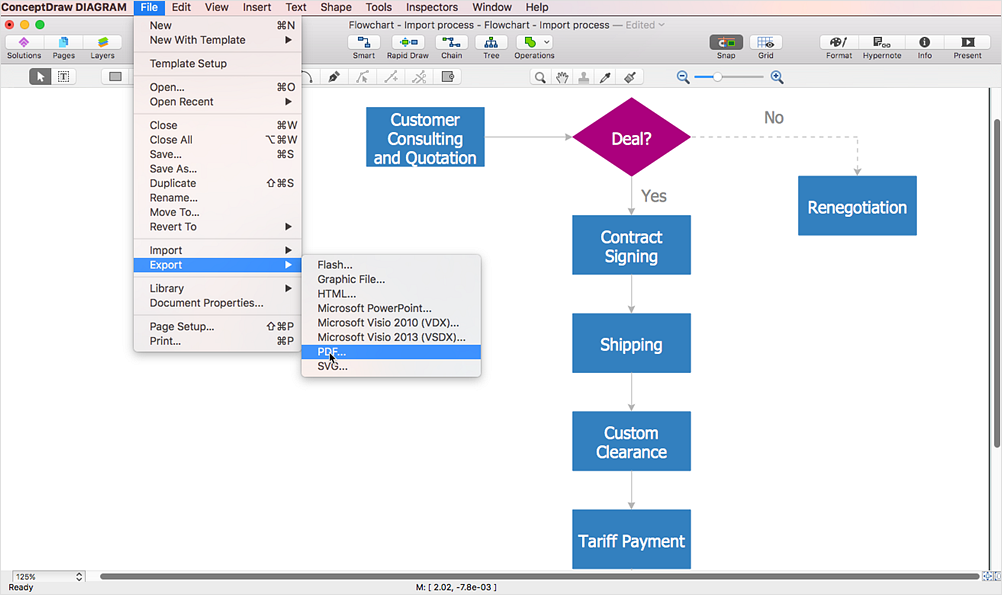
Making flowchart is an easiest way to depict any typical process. Any complex process, consisting from standard components can be displayed as a Flowchart. ConceptDraw DIAGRAM is proved to be a simple and easy tool for creating flowcharts. It does not require the skills of a professional designer. Making flowchart to map any process you will see the ways of its optimization and improvement. Flowchart software is here and you can download it for free.HelpDesk
ConceptDraw Software Full Versions Free Download
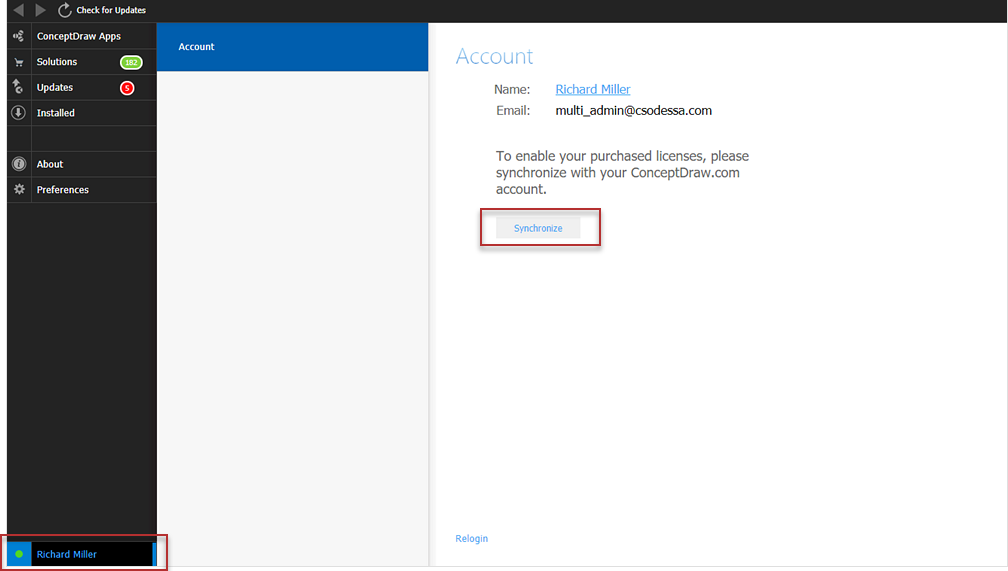
ConceptDraw software provides registered users a 21 day trial period at no charge. It functions exactly as a fully licensed copy of the product does. Once you have activated your account you are then able to download and install ConceptDraw software as well, as solutions from Solution Park. Here is an instructions on how to download and try ConceptDraw products for free. For 21 days the trial functions exactly like the purchased product. There are no limitations to file size, how many times you can print, or any of the products functionality. After the trial period expires, you will be able to open ConceptDraw documents to view.Infographic Maker
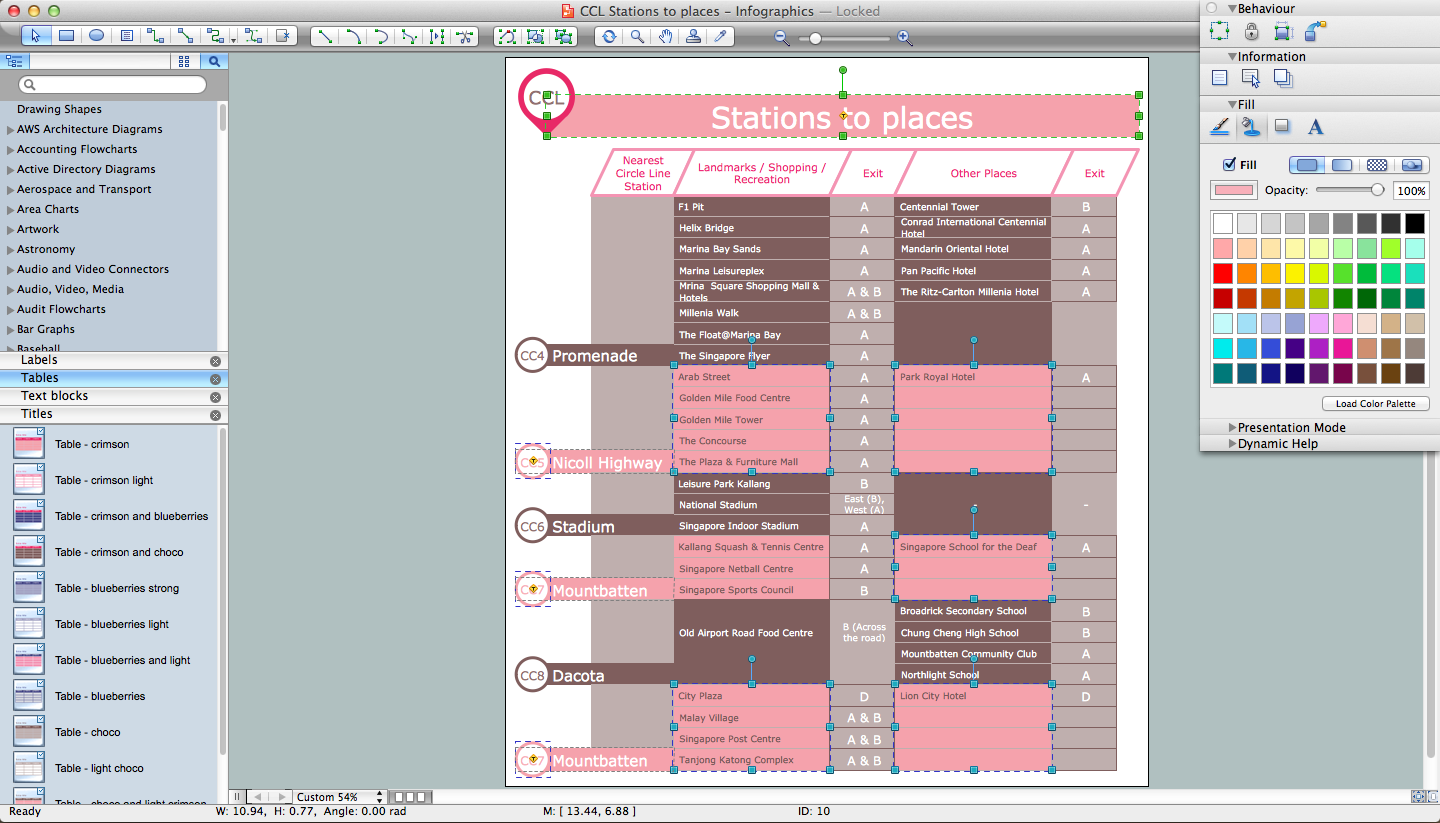
Infographic is a visual way of representing various information, data, knowledge in statistics, geography, journalism, education, and much more areas. ConceptDraw DIAGRAM supplied with Pictorial Infographics Solution from the “Infographics” Area, provides a set of powerful pictorial infographics tools. Thanks to them it is the best Infographic Maker.Scatter Graph Charting Software
ConceptDraw provides some interactive xy chart and scatter graph symbols that offers advanced features yet is simple to use.Typography Infographic Software
ConceptDraw DIAGRAM supplied with Typography Infographics Solution from the “Infographics” Area is a powerful typography infographic software that provides a set of useful typography infographics tools. Use the Typography Infographics Solution for ConceptDraw DIAGRAM typography infographic software to create your own professional looking Typography Infographics of any complexity quick, easy and effective, and then successfully use them in various fields.Marketing Plan Infographic
You need design the Marketing Plan Infographic and dream to find the useful tools to draw it easier, quickly and effectively? ConceptDraw DIAGRAM offers the unique Marketing Infographics Solution from the Business Infographics Area that will help you!Business Diagram Software
When managing the projects, people, or networks, there are daily designed and used different types of Business diagrams, so the powerful drawing software will be very useful for this. ConceptDraw DIAGRAM with large quantity of business solutions will meet your needs and will help you convey your ideas successful and rapidly, no matter are you professional or beginner. It is the best choice for business specialists and technical professionals who need quickly and easily explore, visualize, and communicate information. ConceptDraw DIAGRAM business diagram software is the most powerful business software and relational charting software. Create advanced, completely customizable Business Process Diagrams, Business Flow Charts, Work Flow Diagrams, Organizational Charts, Audit diagrams, Marketing diagrams, Value Stream Maps, TQM diagrams, ERD diagrams, EPC diagrams, Cause and Effect diagrams, Infographics, Dashboards, and other Relational business diagrams from your data using the powerful drawing tools of ConceptDraw Solution Park.
- Free Infographic Software
- Flowchart Software Free Download | Infographic Software ...
- Flowchart Software Free Download | How to draw Metro Map style ...
- Road Map Making Software Free Download
- Free Infographics Tools Downloads
- Flowchart Software Free Download | Spatial infographics Design ...
- Swot Infographics Free Downloads
- Best Tool for Infographic Construction | Map Infographic Maker ...
- Road Maps Creator Free Download
- Note Exchange | Quality Mind Map | Map Infographic Maker | Mind ...


