Map Infographic Creator
Follow samples and map templates to create nfographic maps. It's super-easy!Tools to Create Your Own Infographics
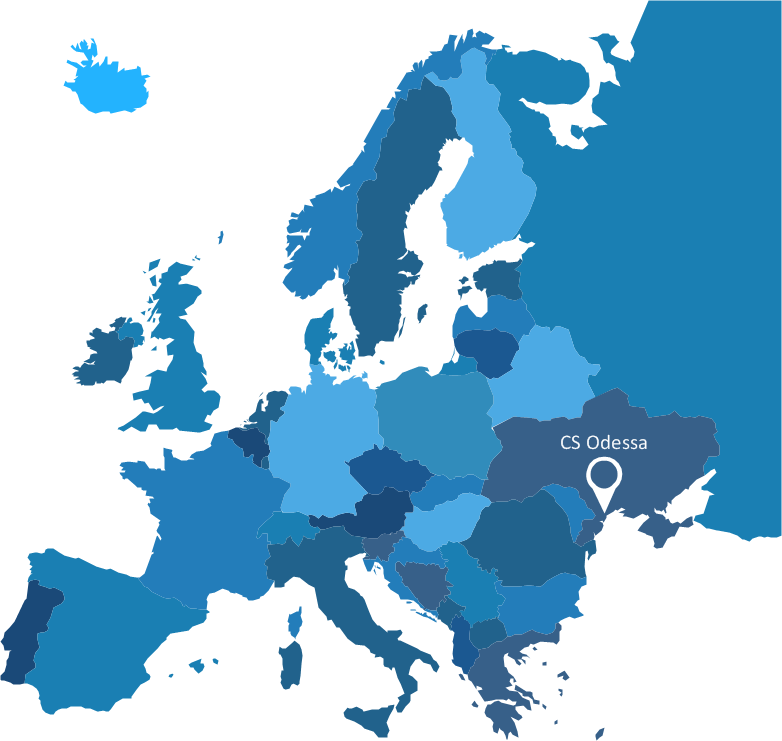
Over the past few centuries, data visualization has evolved so much that we use it every day in all areas of our lives. Many believe that infographic is an effective tool of storytelling, as well as analytics, and that it is able to overcome most of the language and educational barriers. Understanding the mechanisms of human perception will help you to understand how abstract forms and colors used in data visualization can transmit information more efficient than long paragraphs of text.Spatial infographics Design Elements: Continental Map
ConceptDraw PRO is a software for making infographics illustrations. You can work with various components to build really impressive and easy-to-understand infographics design.HelpDesk
How to Create Management Infographics Using ConceptDraw PRO
Management might want to communicate a basic workflow for each division of the company, visualise business strategy and decision processes, or display a certain business training concept. In this case, an infographic can be more text heavy, and use illustrations to establish a timeline, process, or step-by-step sequence of events. ConceptDraw PRO can be used as a tool for creating management infographics. It allows you to draw infographics quickly and easily using the special templates and vector stencils libraries. Infographics can be used to quickly communicate a message, to simplify the presentation of large amounts of data, to see data patterns and relationships, and to monitor changes in variables over time. It can contain bar graphs, pie charts, histograms, line charts, e.t.c.Visualization Spatial Data Using Thematic Maps Combined with Infographics
Now anyone can build an infographics from their data using ConceptDraw. Nice and simple, but the features it have are power-packed!Map Infographic Maker
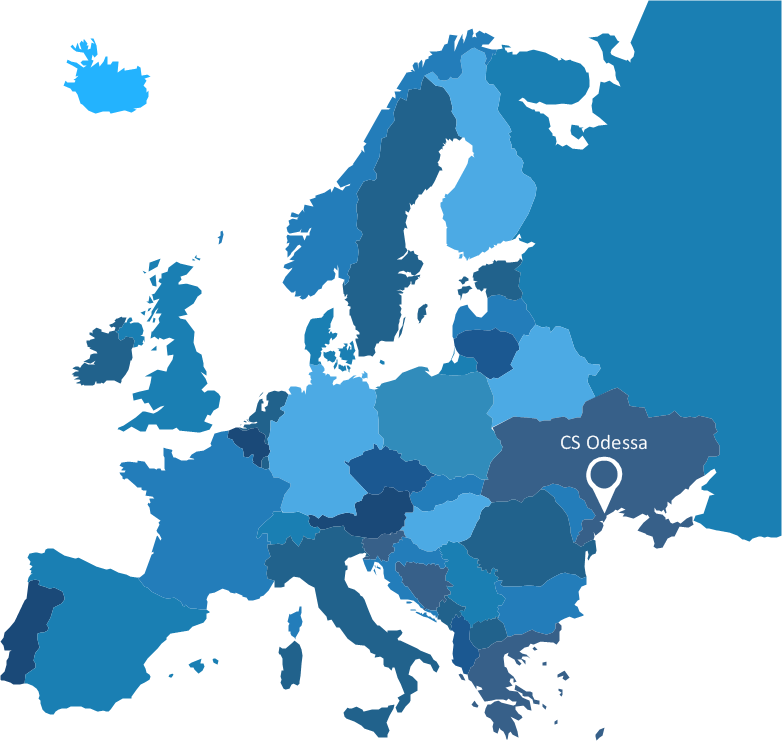
Take inspiration with ConceptDraw to visualise your maps and make eye-catching infographics.HelpDesk
How to Make PowerPoint Presentation of Data Driven Infographics
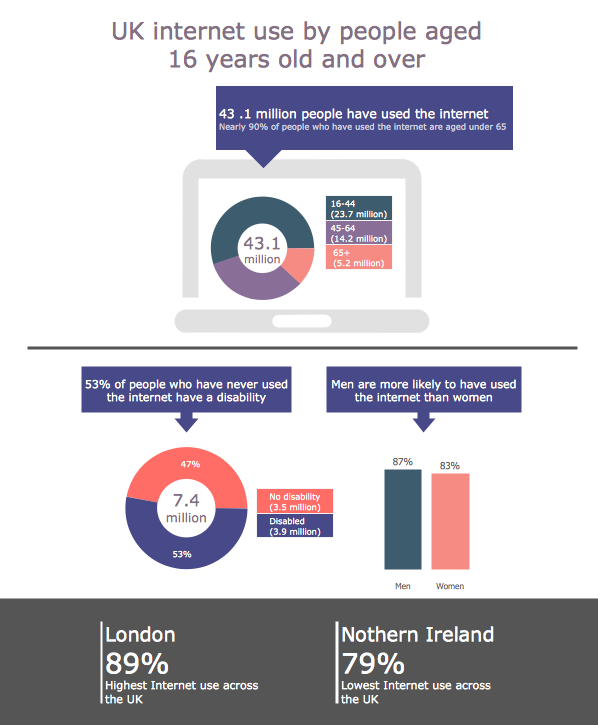
ConceptDraw PRO can be used as a tool for creating data-driven infographics. It allows you to draw data driven using the special templates and vector stencils libraries. ConceptDraw PRO allows you to make a MS PowerPoint Presentation from your Data-driven infographics in a few simple steps.Excellent Examples of Infographic Maps
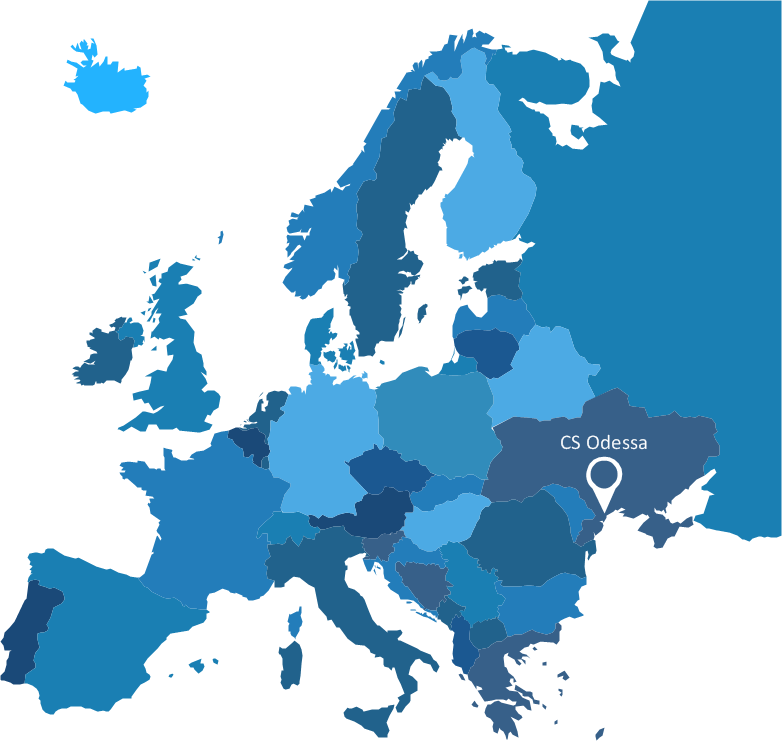
Create Spatial infographics with ConceptDraw using its excellent examples of infographic maps. We hope these can inspire and teach you!Data Infographics
The popularity of visual Data Infographics grows day by day. So it would be nice to have effective software for their quick and easy creating. ConceptDraw PRO extended with Data-driven Infographics Solution from the “Infographics” Area of ConceptDraw Solution Park is exactly what you need.- Infographic Template Powerpoint
- Transit map template | Transport map - Template | Spatial ...
- Map Infographic Creator | Map Infographic Maker | Spatial ...
- SWOT analysis matrix diagram templates | SWOT analysis Software ...
- World Map Infographic Template
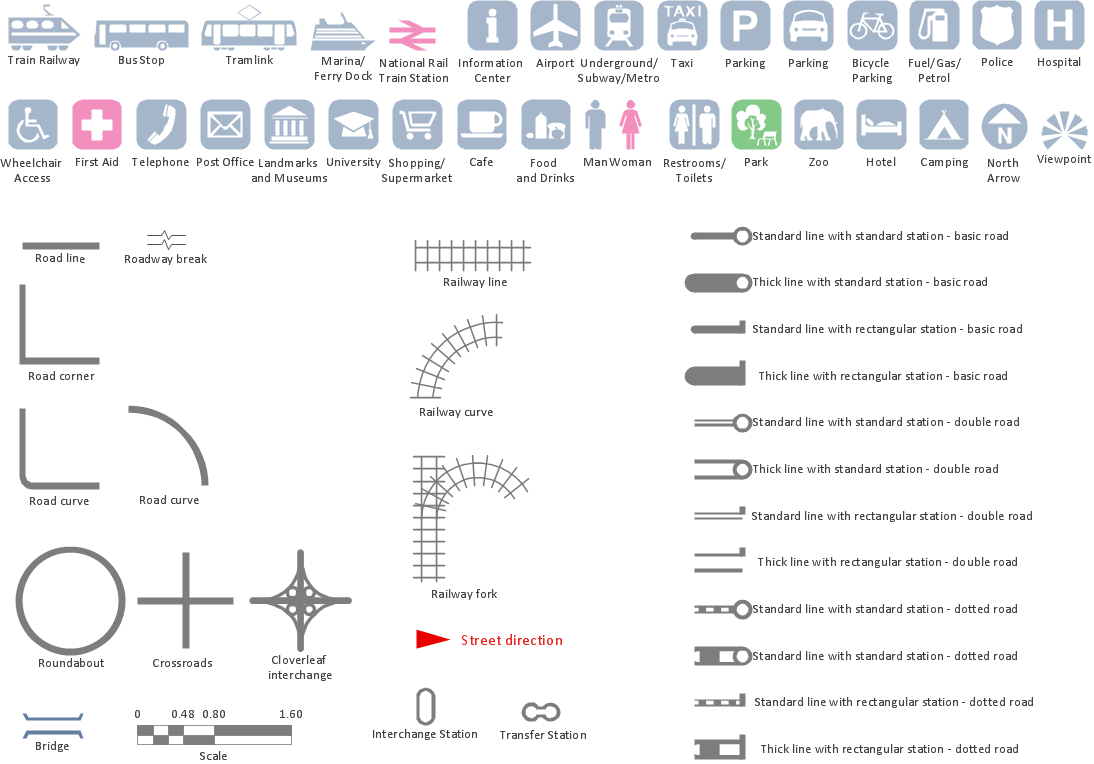
- Spatial infographics Design Elements: Transport Map | Transit map ...
- Infographics Templates
- Note Exchange | Quality Mind Map | Map Infographic Maker | Mind ...
- How To Create a MS Visio Data-driven Infographics Using ...
- How To Create a MS Visio Data-driven Infographics Using ...
