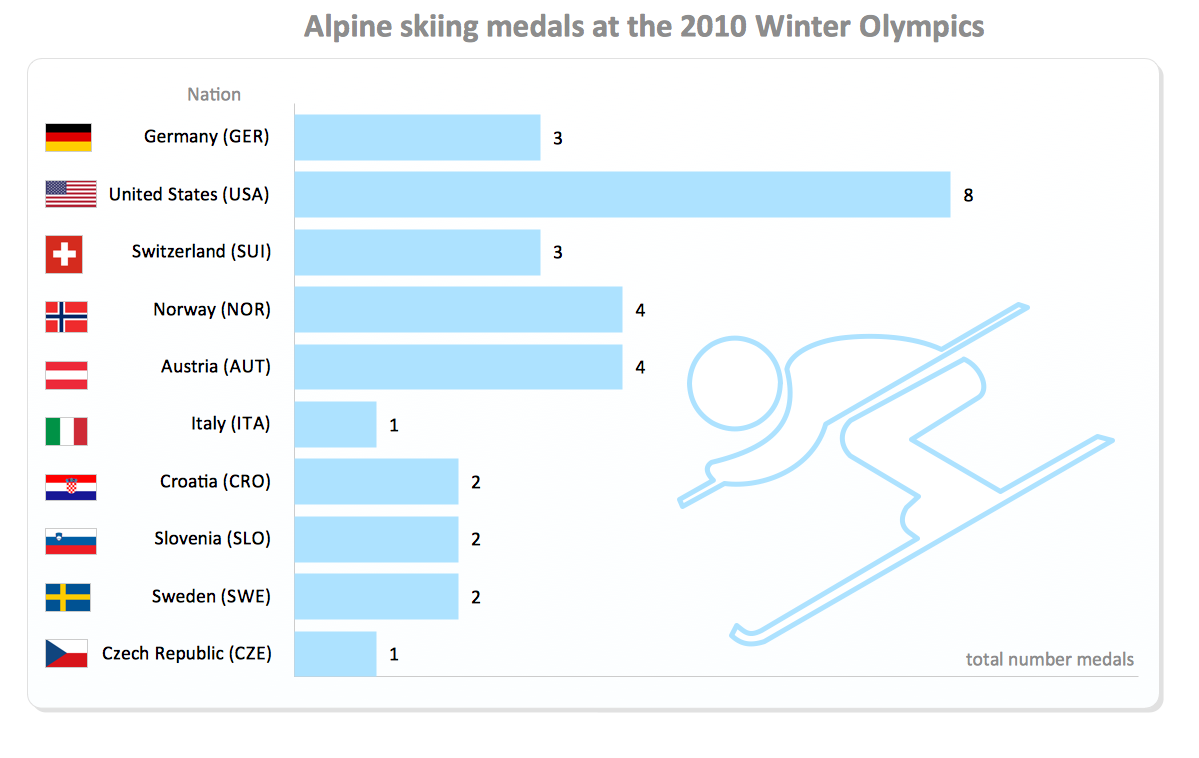
Information Graphics
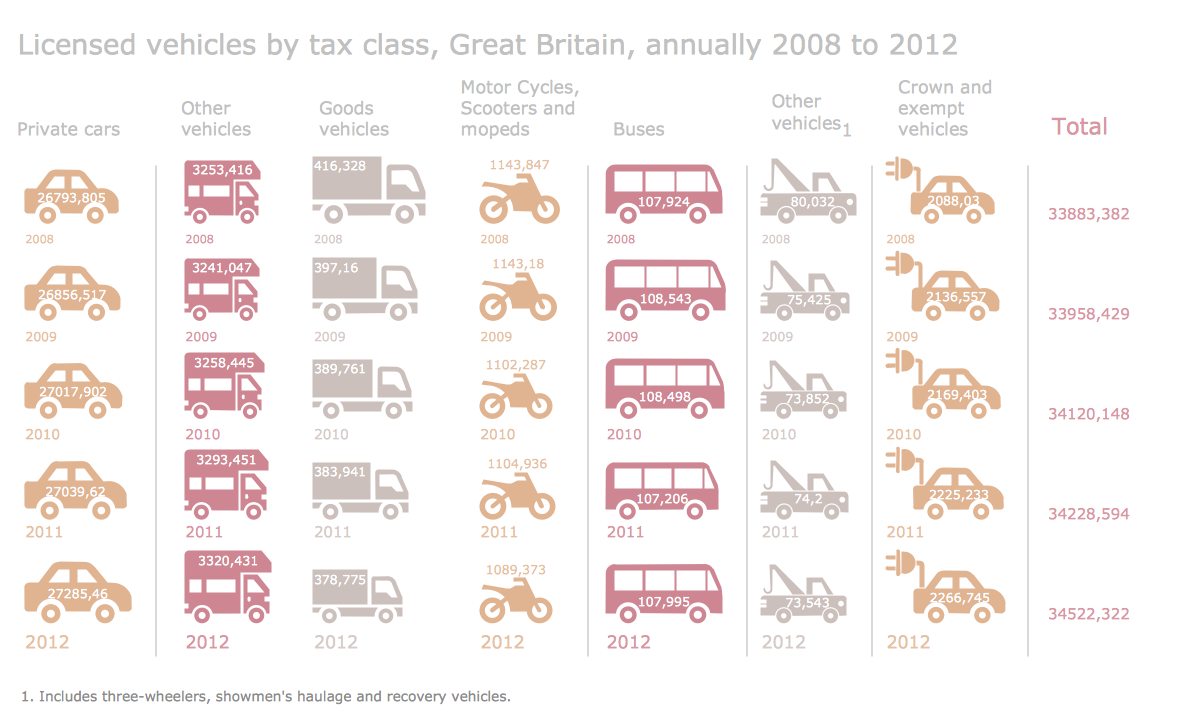
Creating of professional looking Information Graphics was always been a complex process. But now it's easier than ever thanks to the ConceptDraw DIAGRAM diagramming and vector drawing software extended with Pictorial Infographics Solution from the “Infographics” Area.Infographic Software
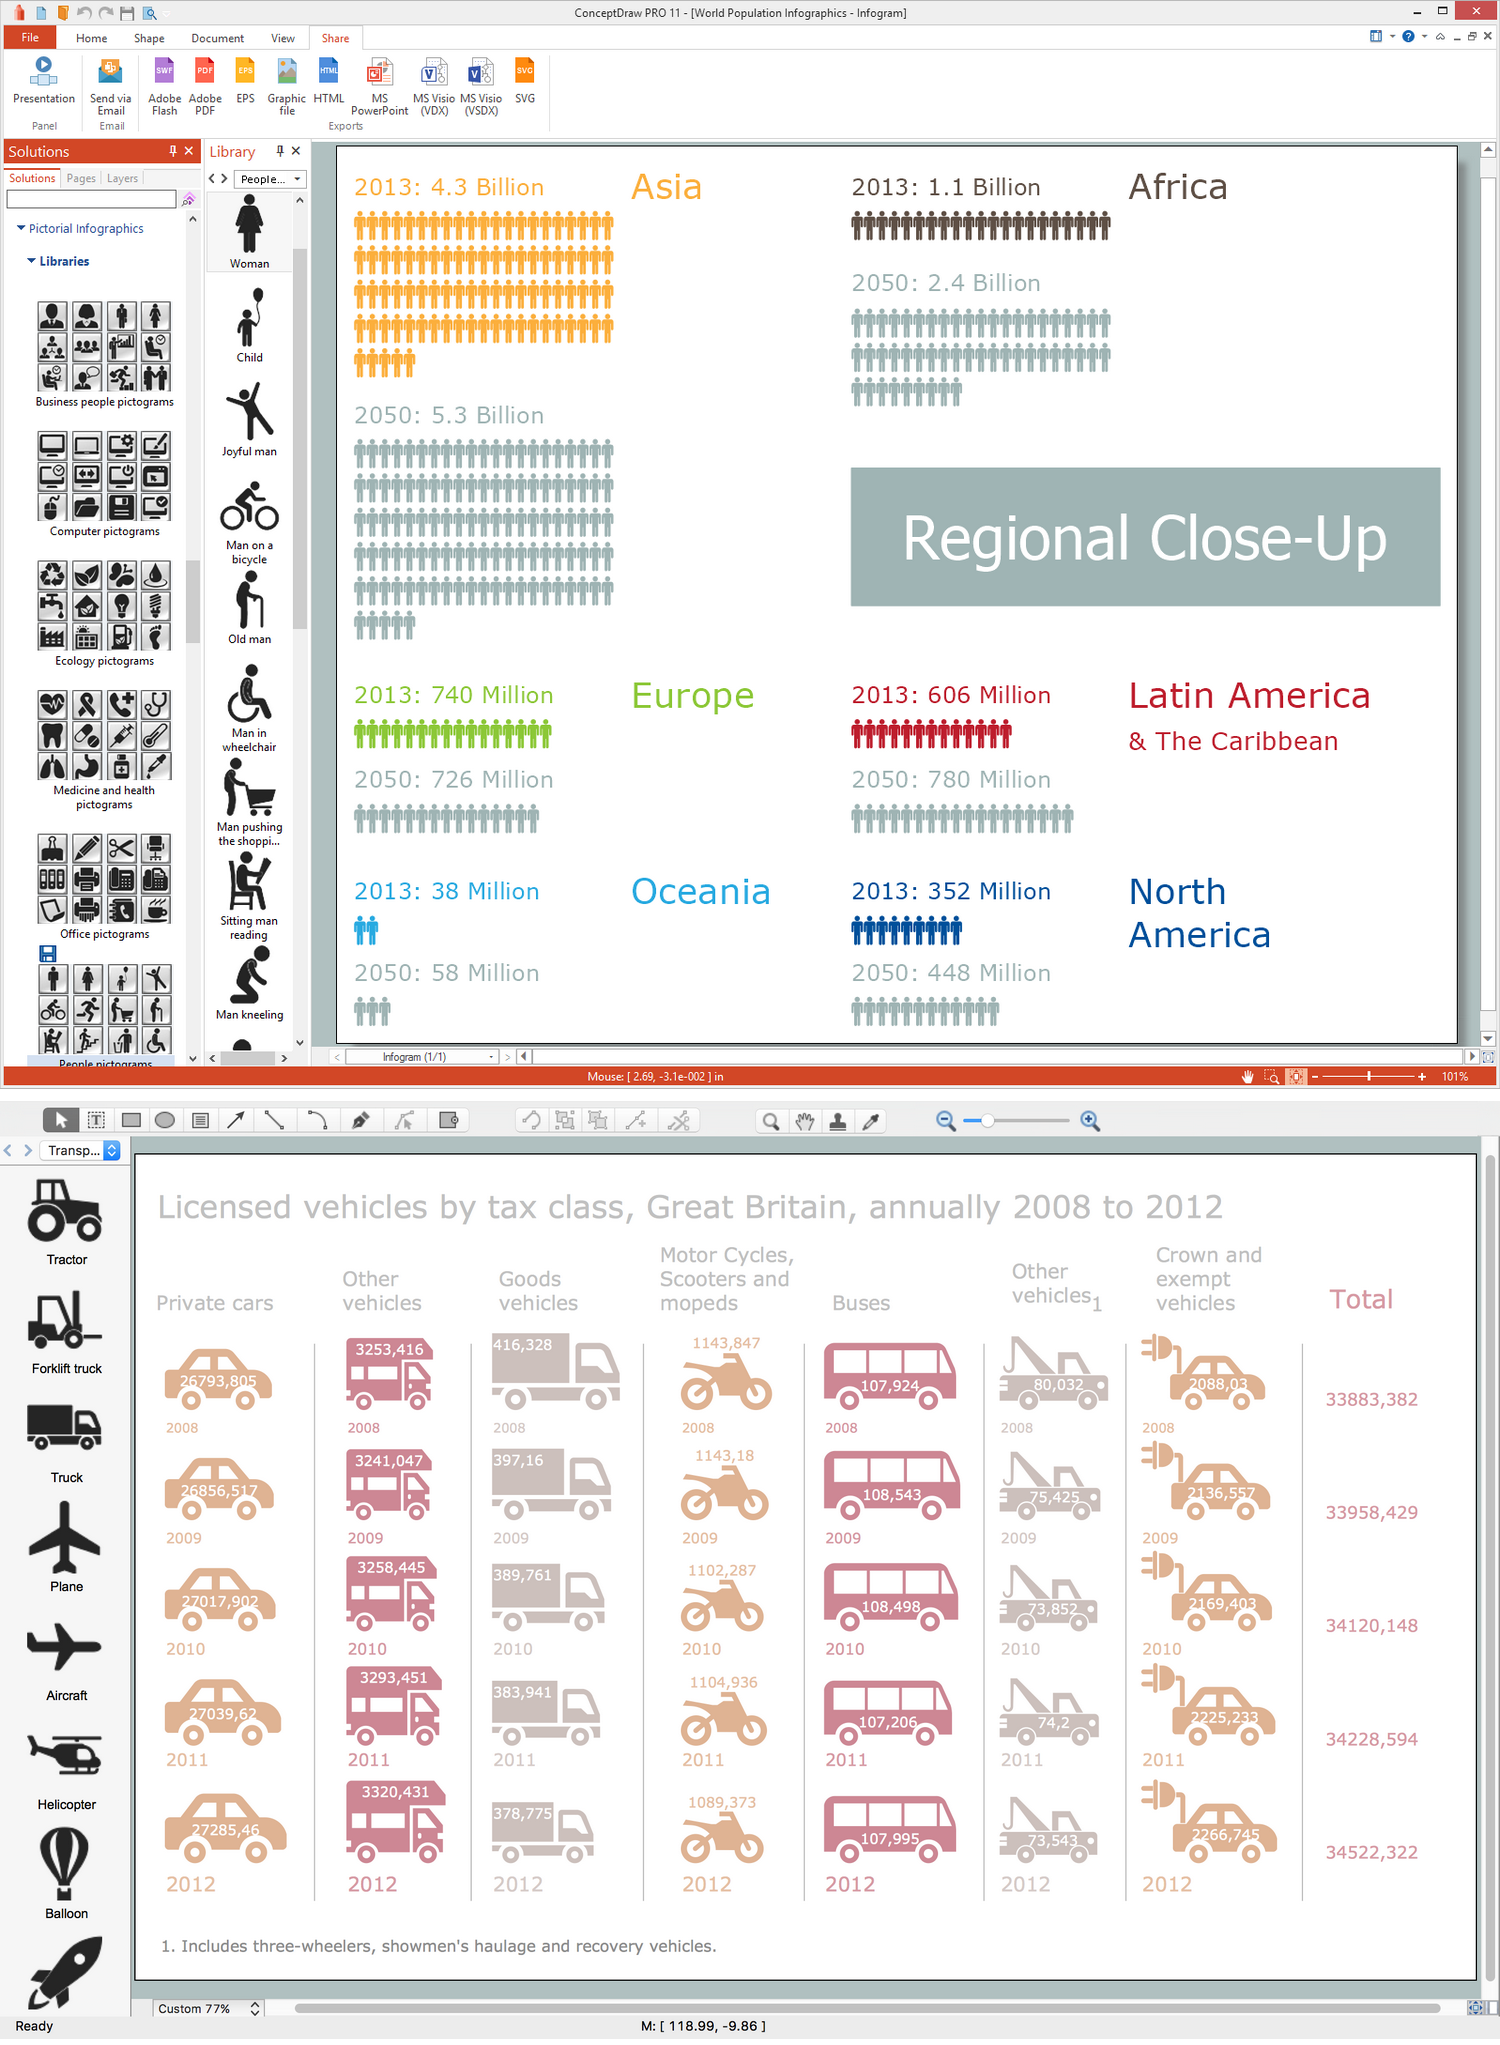
ConceptDraw DIAGRAM extended with Pictorial Infographics Solution from the “Infographics” Area is a powerful Infographic Software. Make sure in it right now!Information Graphic
Information graphic or infographic is a visual representation of various information, data or knowledge. ConceptDraw DIAGRAM extended with unique Education Infographics Solution from the Business Infographics Area will help you design any education information graphic without efforts.Business Graphics Software
ConceptDraw DIAGRAM business graphics software provides wide opportunities for creativity and helps generate amazing visuals by using the included drawing tools. Creatively designed graphics can communicate ideas and information more efficiently. Grow and improve your business and boost your brand awareness through appealing graphic design. Distinct and memorable visuals grab the attention of your audience efficiently. Create well-designed, attractive, and stylish graphical content with the Business Process Workflow Diagrams solution. The colorful graphics are pleasing to the eyes, impact positive first impression, and make reading the content more interesting. Highlight important things with colors or differentiated fonts.Donut Chart
ConceptDraw DIAGRAM diagramming and vector drawing software offers the Pie Charts solution from the Graphs and Charts area which includes the tools for quick and easy designing any kind of Donut Chart.Basic Diagramming
Perfect charts and graphics diagramming software with rich examples and template. ConceptDraw is ideal to draw Charts and Graphics. How to Create Flowcharts for anAccounting Information System
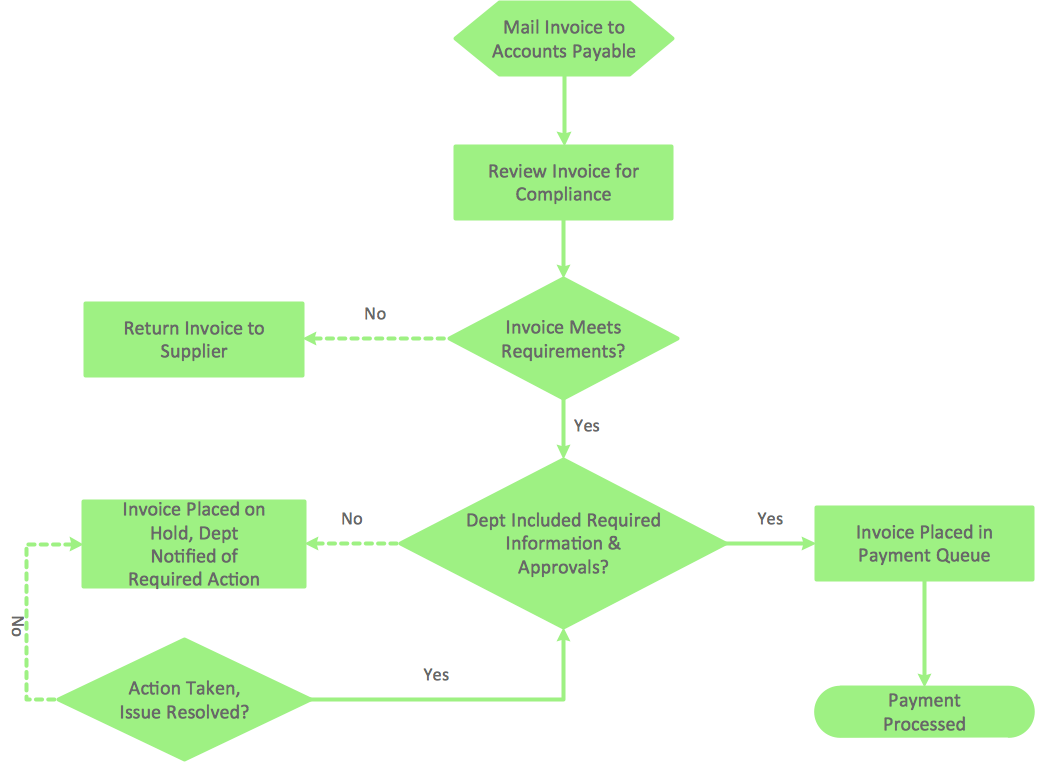
Accounting information is a system of interrelated processes which represent financial and accounting data, required for decision making. For representing the accounting processes in a visual and easy for perception form are constructed Accounting Flowcharts. For their creation are used special flowchart symbols, this makes Accounting flowcharts understandable for all users of accounting information system and helps them easy understand the sequence of steps involved to accounting processes.
But how to create Flowcharts for an Accounting Information System fast and easy? Use of special design software is useful for this. ConceptDraw DIAGRAM software extended with Accounting Flowcharts solution is the best for creation accurate Accounting Flowcharts, for documentation and visually communication on how accounting processes work, how each operation is done. Accounting Flowcharts solution is supplied with library of predesigned commonly used vector symbols, Accounting Flowchart templates and samples demonstrating receiving, purchasing, payment, and other accounting processes.
Building Social Media Response Plan DFD
Using ConceptDraw software is your key to an effective social media marketing plan. Interactive Flowcharts can change the way one creates and organizes their social media response process. Visual navigation through the stages of a response process helps you locate specific actions to be taken via Action Mind Maps.Software Diagrams
Modern software development begins with designing different software diagrams and also uses a large amount of diagrams in project management and creation graphic documentation. Very popular diagrams that depict a work of applications in various cuts and notations, describe databases and prototype Graphical User Interfaces (GUIs). Software engineering specialists and software designers prefer to use special technical and business graphics tools and applications for easy creation diagrams. One of the most popular is ConceptDraw DIAGRAM diagramming and vector drawing software. ConceptDraw DIAGRAM offers the possibility of drawing with use of wide range of pre-drawn shapes and smart connectors, which allow to focus not on the process of drawing, but on the task's essence. It is a perfect application for design and document development, planning tasks, visualization of data, design the databases, object-oriented design, creation flowcharts of algorithms, modeling business processes, project management, automation of management and development processes, and for many other tasks.Draw Fishbone Diagram on MAC Software
The problem solving and decision-making processes are closely linked and crucial for the business and life. There are many tools and techniques for facilitating and improvement these processes, and also enhancement the quality of accepted decisions. One of them is Fisbone Diagram or Cause and Effect diagram. For its construction, you need first define the problem which you need to solve (existing or potential), write it into rectangular and draw to it a horizontal line - a “fish spine”. Then define general types of possible causes like Persons, Materials, Methods, Machinery, Measurements or Environment, and attach them to “spine”. Start brainstorming the possible reasons of failure and connect them to the branches. Professional diagramming ConceptDraw DIAGRAM MAC OSX software offers the Fishbone Diagrams solution which contains templates, samples, and ready Fishbone design objects. Use of them lets effectively identify the possible causes for an effect, realize successfully cause and effect analysis, and instantly draw Fishbone diagram on Mac software.Tools to Create Your Own Infographics
Over the past few centuries, data visualization has evolved so much that we use it every day in all areas of our lives. Many believe that infographic is an effective tool of storytelling, as well as analytics, and that it is able to overcome most of the language and educational barriers. Understanding the mechanisms of human perception will help you to understand how abstract forms and colors used in data visualization can transmit information more efficient than long paragraphs of text.How tо Represent Information Graphically
ConceptDraw Infographics is a great visual tool for communicating the large amounts of data and graphic visualization and representations of data and information.Graphics Software for Business
If you want to use effective methods for your business, you may need a tool which may let you represent your ideas and goals in graphic way. Software with different flowchart templates for each type of business will be your lifesaver. ConceptDraw DIAGRAM with its business samples, libraries and design elements is a point to start.Data Flow Diagram (DFD)
A Data Flow Diagram (DFD) illustrates the flow of data through an information system, visualizes how the information is handled in terms of inputs and outputs, how the data enter to system and leave it. It is effective to use a Data Flow Diagram for creation the system's overview, to show the system's scope and boundaries. There are two different types of notations for DFDs: Yourdon-Coad and Gane-Sarson, which differ in visual representations for processes, data flow, data stores, external entities, etc. Thus, for example the processes are depicted as circles in Yourdon-Coad notation and as rounded squares in Gane-Sarson notation. Gane-Sarson notation is usually used for visualization information systems and Yourdon-Coad - for system analysis and design. The Data Flow Diagrams solution included to Software Development area of ConceptDraw Solution Park offers a lot of DFD templates, samples and examples, libraries of vector stencils for construction without efforts the DFDs according to both Gane-Sarson and Yourdon-Coad notations.Business Graphics and Diagramming Package
The innovative ConceptDraw Arrows10 Technology included in ConceptDraw DIAGRAM Package is a powerful drawing software that changes the way diagrams could be created. You don't have to guide your connectors, they do this automatically. Get software for creating business graphics such as charts and graphs, diagrams, organizational charts, multimedia presentations, and visual demonstrations.Why Flowchart is Important to Accounting Information System?
Flowcharts are used to represent accounting information in a system. There are special symbols which are used to create accounting flowcharts.SIPOC Diagram
SIPOC is a tool that summarizes the inputs and outputs of one or more processes in table form. You need to draw professional looking SIPOC Diagram quick and easy? Pay please your attention on ConceptDraw DIAGRAM diagramming and vector drawing software. Extended with Business Process Mapping Solution from the Business Processes Area of ConceptDraw Solution Park, it suits ideal for this.Infographics Free Software
Organize your information efficiently in an infographic with the help of powerful ConceptDraw DIAGRAM software and a set of free infographic solutions Typography Infographics, Pictorial Infographics, Data-driven Infographics, Spatial Infographics, and others. Infographics free software helps to communicate complex information in an eye-catching and engaging way. Visual elements like graphs and charts help to simplify and summarize complex information, facilitate comparison and identification of patterns, trends, and differences, increase engagement and attention, and make it easier to understand and memorize for the audience. Use the predesigned vector elements from the solutions libraries to save time and design without effort professionally looking infographics.Professional Diagram and Flowchart Software
ConceptDraw DIAGRAM is a Mac OS X and Windows platforms professional software to draw your own business process diagrams and flowcharts.- Information Graphics | Flowchart Software
- Information Graphic | Education Information | Biology Illustration ...
- Education Infographics | Educational Materials | Information Graphic ...
- Information Graphics | Sample Pictorial Chart. Sample Infographics ...
- How to Create Education Infographics | Information Graphic ...
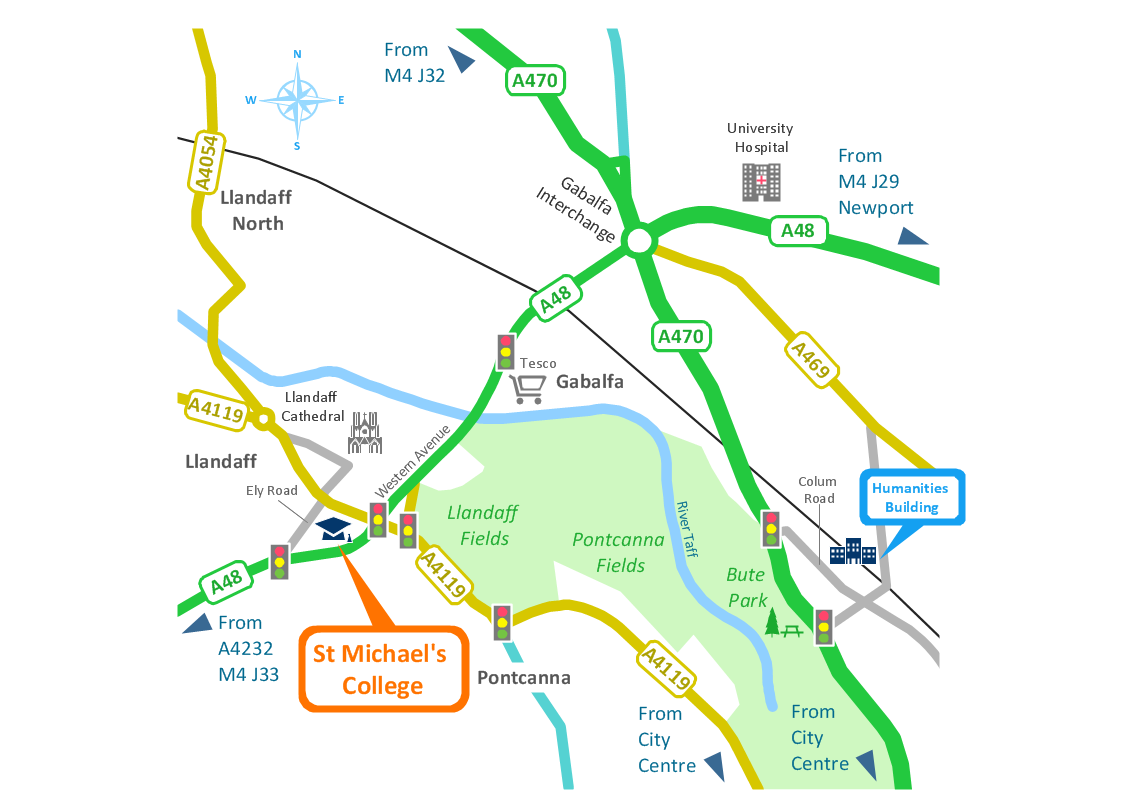
- Spatial Infographics | Spatial Infographics | Map Infographic Design ...
- How to Create Education Infographics | ConceptDraw Solution Park ...
- Business Report Pie. Pie Chart Examples | Information Graphics ...
- Biology Illustration | Information Graphic | Educational Technology ...