Bar Chart Software
The best bar chart software ever is ConceptDraw. ConceptDraw bar chart software provides an interactive bar charting tool and complete set of predesigned bar chart objects.Best Diagramming Software for macOS
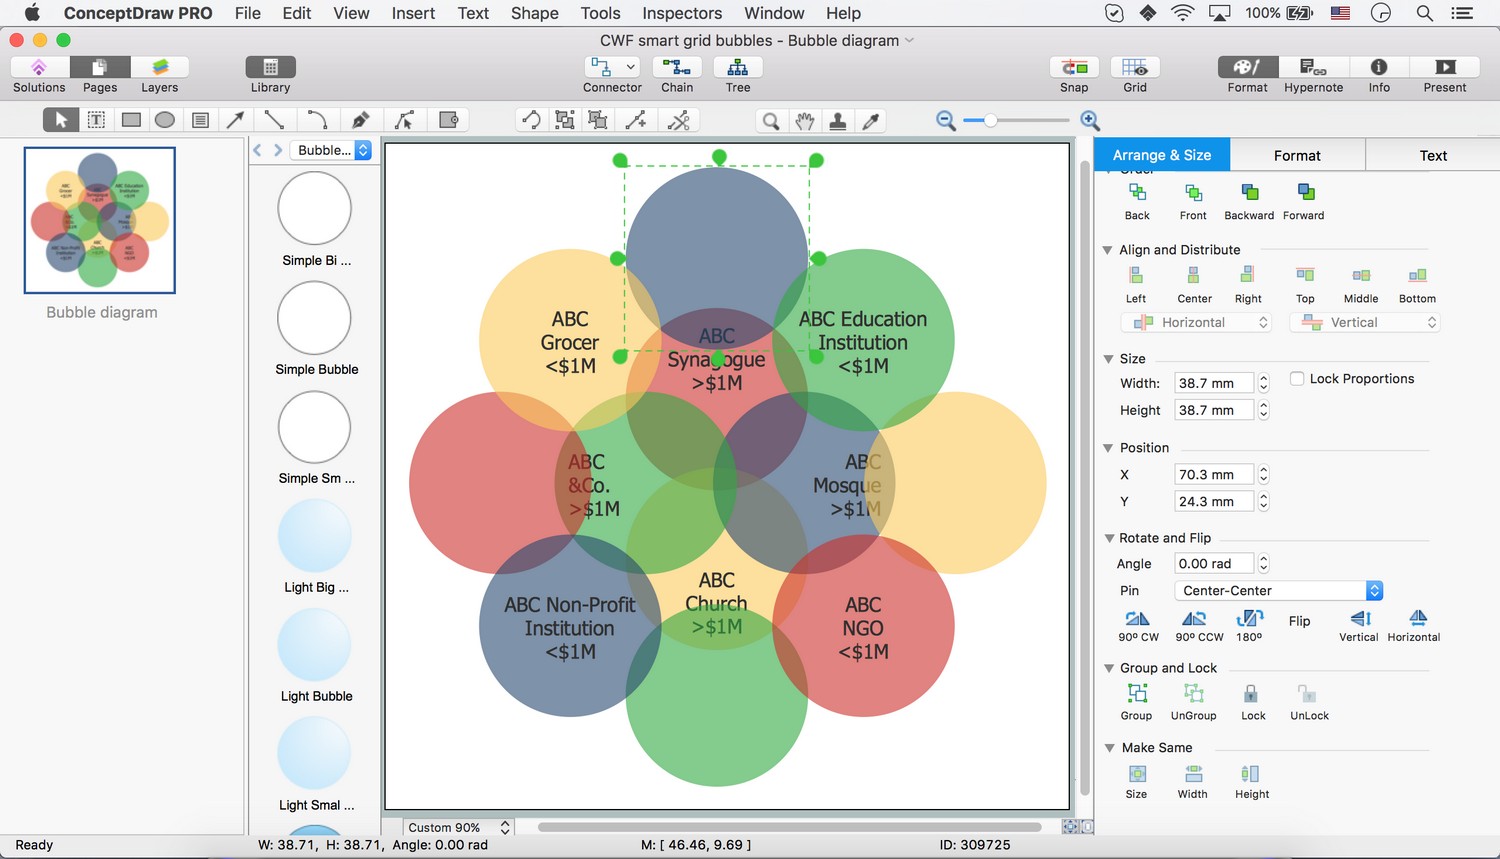
ConceptDraw PRO creates drawings, flowcharts, block diagrams, bar charts, histograms, pie charts, divided bar diagrams, line graphs, area charts, scatter plots, circular arrows diagrams, Venn diagrams, bubble diagrams with great visual appeal on Mac OS X.
How to Create Presentation of Your Project Gantt Chart
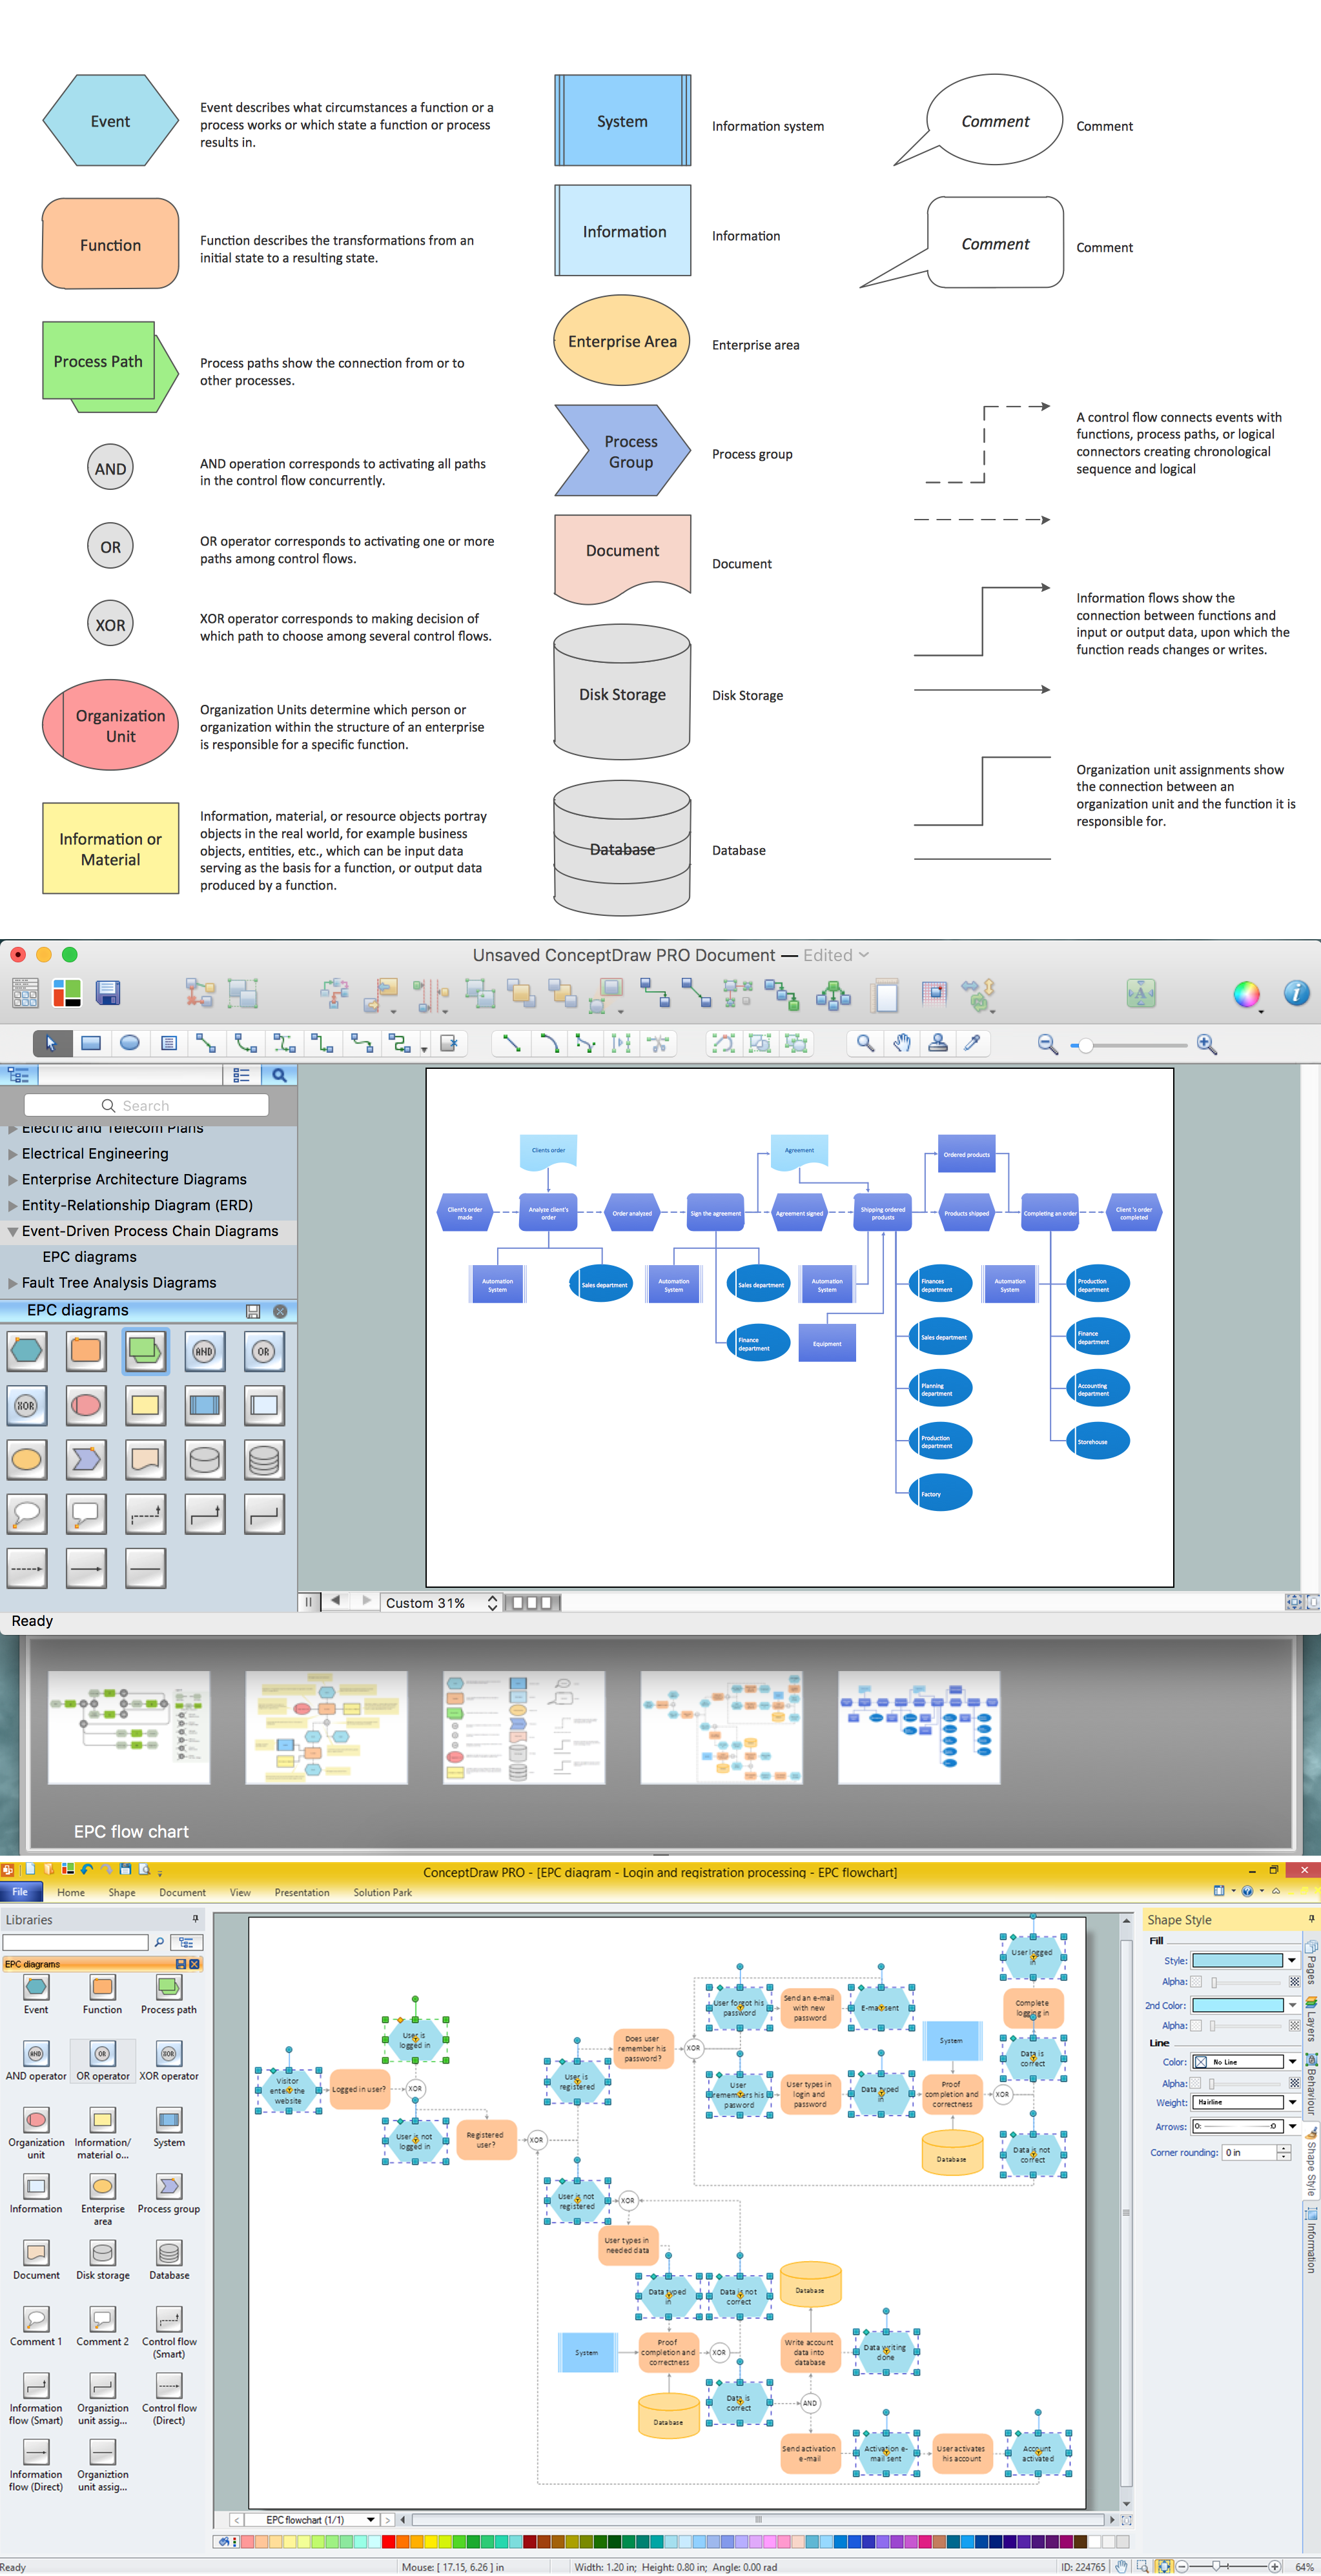
During the planning, discussing and execution of a project you may need to prepare a presentation using project views such as the Gantt Chart, Multiproject Dashboard or Resource Usage View. It’s easy do with ConceptDraw PROJECT!Business process Flow Chart - Event-Driven Process chain (EPC) diagrams
Event-Driven Process chain Diagrams for improvement throughout an organisation. Best software for Process Flow Diagram. The Event-driven Process Chain (EPC) Diagrams allows managers to plan processes and resources.How to Create a Pie Chart
Create a Pie Chart with ConceptDraw software quickly and easily. The simple tutorial helps you learn how to create a pie chart.Basic Diagramming
Mathematics is an exact science, which studies the values, spatial forms and quantitative relations. It is a science, in which is built large number of various diagrams, charts and graphs that present the material in a clear, visual and colorful form, help to analyze the information and to make certain conclusions. A diagram is a graphical representation of data using the linear segments or geometric shapes, which allows to evaluate the ratio of several values. Depending on the types of solved tasks are used the diagrams of different kinds. A graph is a diagram that shows quantitative dependencies of various processes using the curves. ConceptDraw PRO is a powerful intelligent and multifunctional vector engine for drawing different Mathematical diagrams and graphs, Mathematical illustrations, complex and simple Diagram mathematics, Flowcharts of equation solving process, Line graphs, Scatter plots, Histograms, Block diagrams, Bar charts, Divided bar diagrams, Pie charts, Area charts, Circular arrows diagrams, Venn diagrams, Bubble diagrams, Concept maps, and many others.
Blank Scatter Plot
This sample shows the Scatter Plot without missing categories. It’s very important to no miss the data, because this can have the grave negative consequences. The data on the Scatter Chart are represented as points with two values of variables in the Cartesian coordinates. This sample can be used in the engineering, business, statistics, analytics, at the creating the financial and other types of reports.- Information Transfer Pie Chart Bar Diagrams Flow Charts
- Information Transfer Examples Of Flow Bar Pie Charts
- Information Transfer Through Pie Chart Examples
- Pie Chart Information Transfer
- Information Transfer Pie Chart Examples
- Make Pie Diagram From Information Transfer
- Examples For Pie Chart Tree Diagram Bar Graph Flow Chart
- Pie Chart Bar Chart Flow Chart Define
- Process Flowchart | Pyramid Diagram | How to Simplify Flow ...
- Charts Pie Flow Bar
- Information Design Pie Chart Bar Area When To Use
- Information Transfer From Piechart Tequnie
- Pie Chart Flow Chart Bar Chart
- Information Transfer Into Pie Diagram
- Pie Chart Flow Chart Bar Diagram
- Pie Chart Examples and Templates | Process Flowchart | Basic ...
- Information Transfer Of Pie Chart
- Presenting Information In Flow Chart Pie Chart Histogram Diagram
- Examples of Flowcharts , Org Charts and More | Pie Chart Examples ...
- Bar Diagrams for Problem Solving. Create economics and financial ...


