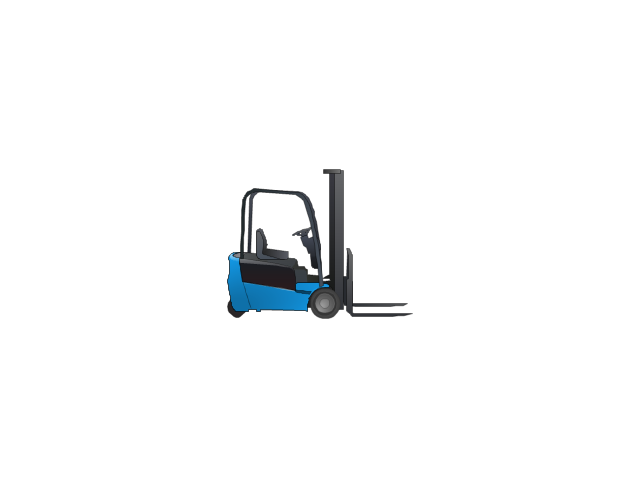
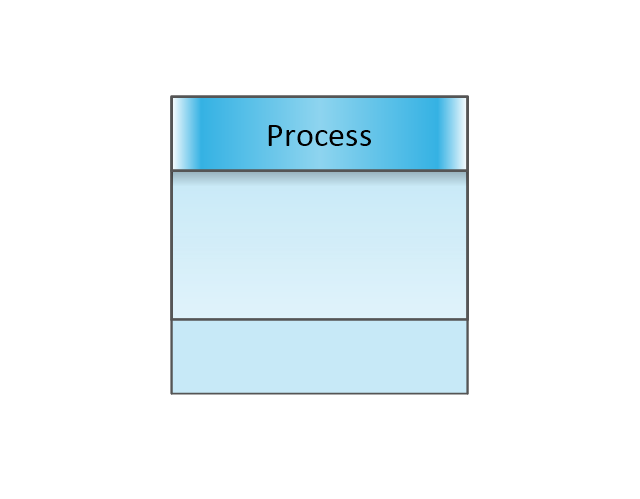
The vector stencils library "Value stream mapping" contains 43 VSM symbols.
Use it for drawing value stream maps in the ConceptDraw PRO diagramming and vector drawing software extended with the Value Stream Mapping solution from the Quality area of ConceptDraw Solution Park.
www.conceptdraw.com/ solution-park/ business-value-stream-mapping
Use it for drawing value stream maps in the ConceptDraw PRO diagramming and vector drawing software extended with the Value Stream Mapping solution from the Quality area of ConceptDraw Solution Park.
www.conceptdraw.com/ solution-park/ business-value-stream-mapping
A five level pyramid model of different types of Information Systems based on the information processing requirement of different levels in the organization. The first level represents transaction processing systems to process basic data. The second level represents office support systems to process information in office. The third level represents management information systems to process information by managers. The fourth level represents decision support systems to process explicit knowledge. The fifth level represents executive information systems to process tacit knowledge.
"A Computer(-Based) Information System is essentially an IS using computer technology to carry out some or all of its planned tasks. The basic components of computer based information system are:
(1) Hardware - these are the devices like the monitor, processor, printer and keyboard, all of which work together to accept, process, show data and information.
(2) Software - are the programs that allow the hardware to process the data.
(3) Databases - are the gathering of associated files or tables containing related data.
(4) Networks - are a connecting system that allows diverse computers to distribute resources.
(5) Procedures - are the commands for combining the components above to process information and produce the preferred output.
The first four components (hardware, software, database and network) make up what is known as the information technology platform. Information technology workers could then use these components to create information systems that watch over safety measures, risk and the management of data. These actions are known as information technology services." [Information systems. Wikipedia]
This pyramid diagram was redesigned using the ConceptDraw PRO diagramming and vector drawing software from Wikimedia Commons file Five-Level-Pyramid-model.png. [commons.wikimedia.org/ wiki/ File:Five-Level-Pyramid-model.png]
This file is licensed under the Creative Commons Attribution 3.0 Unported license. [creativecommons.org/ licenses/ by/ 3.0/ deed.en]
The triangle chart example "Information systems types" is included in the Pyramid Diagrams solution from the Marketing area of ConceptDraw Solution Park.
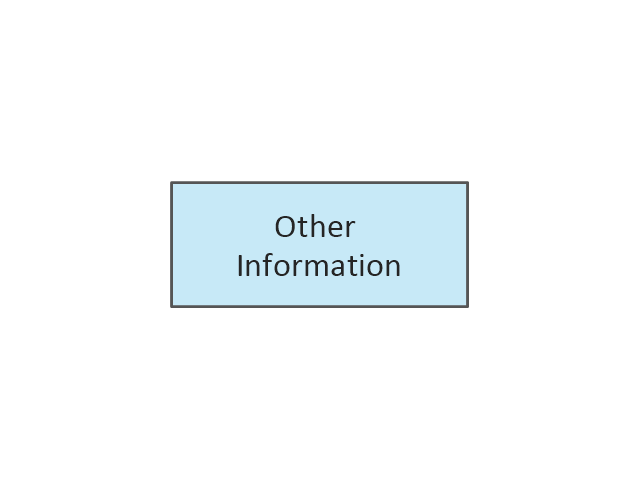
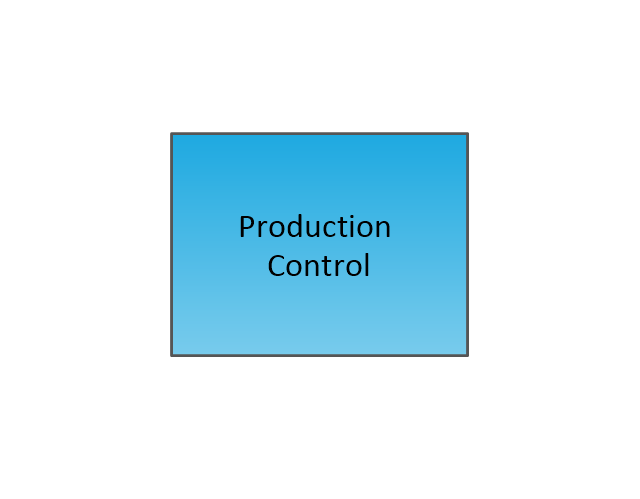
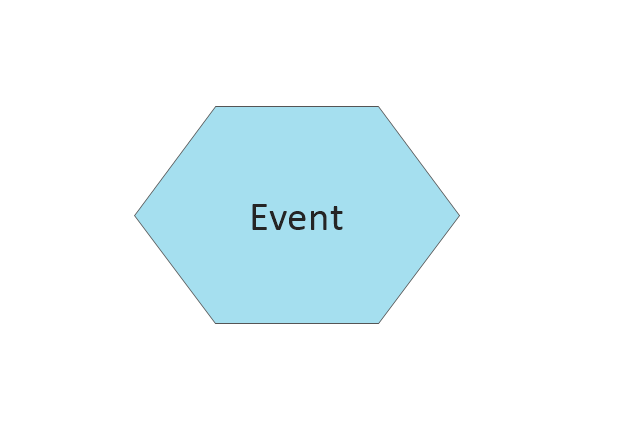
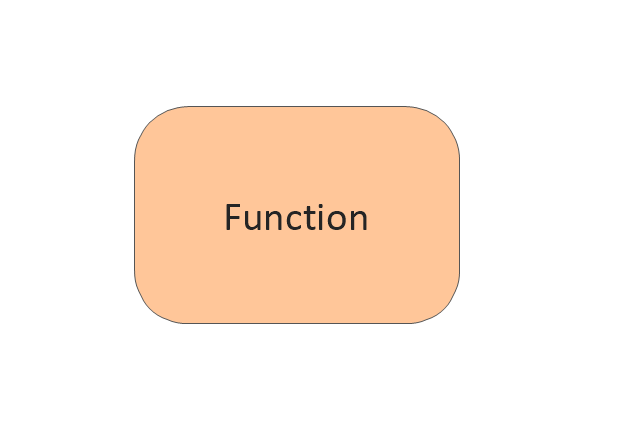
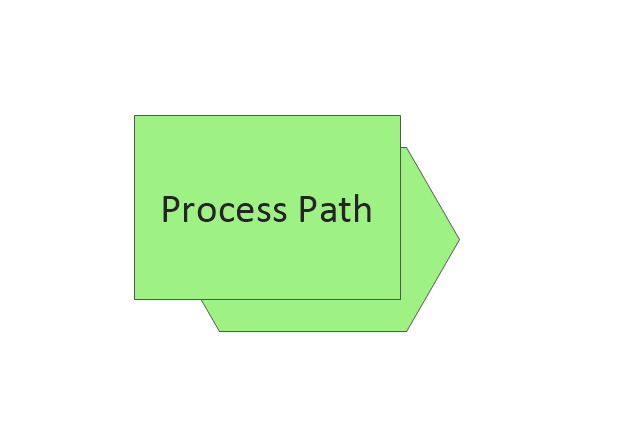
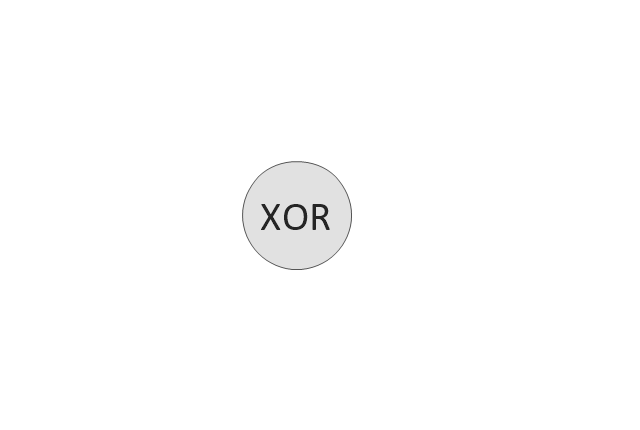
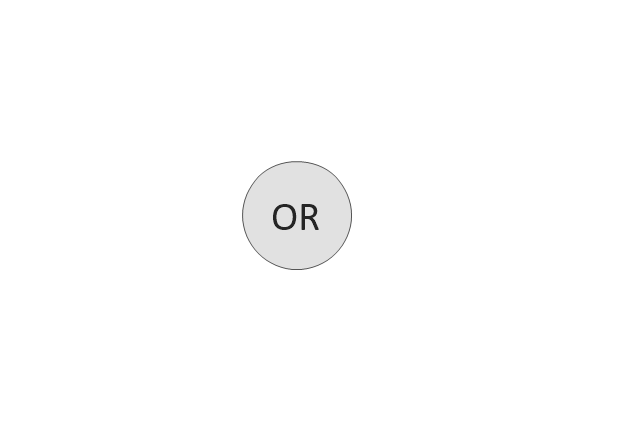
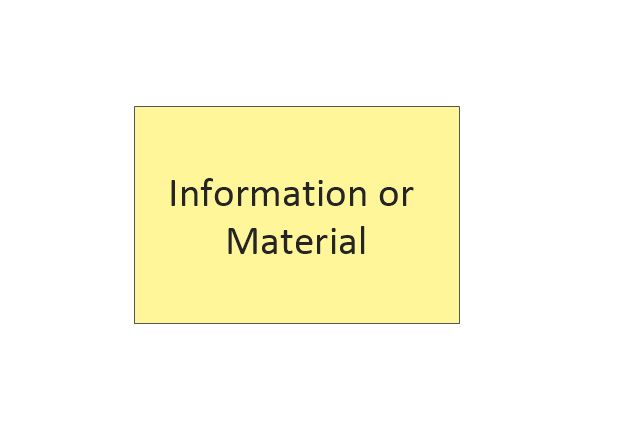
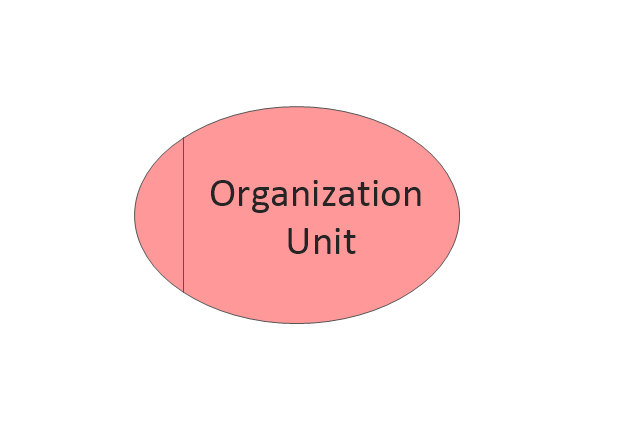
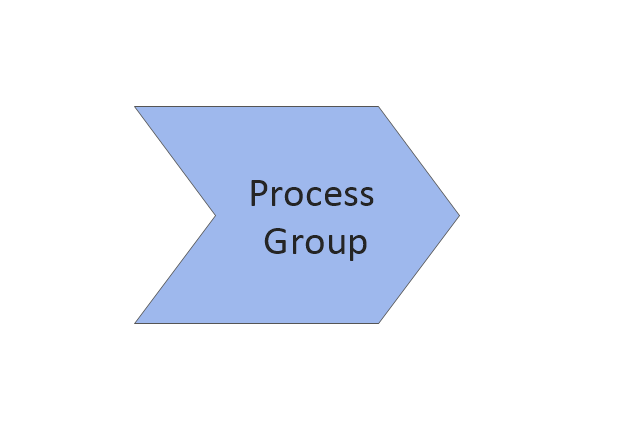
The vector stencils library "EPC diagrams" contains 23 EPC symbols.
Use it for drawing event-driven process chain (EPC) diagrams in the ConceptDraw PRO diagramming and vector drawing software extended with the Event-driven Process Chain Diagrams solution from the Business Processes area of ConceptDraw Solution Park.
www.conceptdraw.com/ solution-park/ business-process-EPC
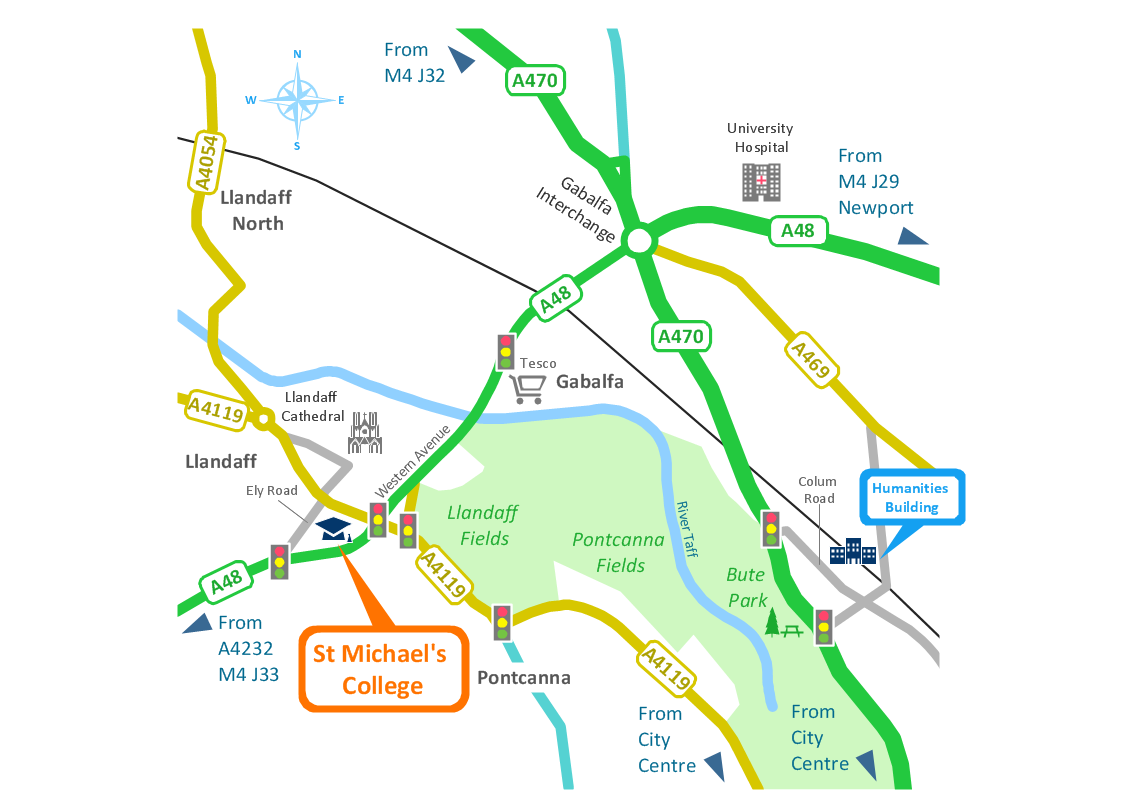
The vector stencils library "Transport map" contains 96 pictograms for drawing transport maps.
Use it in your spatial infographics for visual representation of transport schemes and plans as metro maps in the ConceptDraw PRO diagramming and vector drawing software extended with the Spatial Infographics solution from the area "What is Infographics" of ConceptDraw Solution Park.
Use it in your spatial infographics for visual representation of transport schemes and plans as metro maps in the ConceptDraw PRO diagramming and vector drawing software extended with the Spatial Infographics solution from the area "What is Infographics" of ConceptDraw Solution Park.
How tо Represent Information Graphically
ConceptDraw Infographics is a great visual tool for communicating the large amounts of data and graphic visualization and representations of data and information.A four level pyramid model of different types of Information Systems based on the different levels of hierarchy in an organization. The first level represents transaction processing systems for workers. The second level represents management information systems for middle managers. The third level represents decision support systems for senior menegers. The fourth level represents executive information systems for executives.
"The "classic" view of Information systems found in the textbooks in the 1980s was of a pyramid of systems that reflected the hierarchy of the organization, usually transaction processing systems at the bottom of the pyramid, followed by management information systems, decision support systems, and ending with executive information systems at the top. Although the pyramid model remains useful, since it was first formulated a number of new technologies have been developed and new categories of information systems have emerged, some of which no longer fit easily into the original pyramid model.
Some examples of such systems are:
data warehouses,
enterprise resource planning,
enterprise systems,
expert systems,
search engines,
geographic information system,
global information system,
office automation." [Information systems. Wikipedia]
This diagram was redesigned using the ConceptDraw PRO diagramming and vector drawing software from Wikimedia Commons file Four-Level-Pyramid-model.png. [commons.wikimedia.org/ wiki/ File:Four-Level-Pyramid-model.png]
This file is licensed under the Creative Commons Attribution-Share Alike 3.0 Unported license. [creativecommons.org/ licenses/ by-sa/ 3.0/ deed.en]
The triangle chart example "Information systems types" is included in the Pyramid Diagrams solution from the Marketing area of ConceptDraw Solution Park.
The vector stencils library "Progressive disclosure controls" contains 12 icons of Windows 8 progressive disclosure controls.
Use it to design graphic user interface (GUI) prototypes of your software applications for Windows 8.
"With a progressive disclosure control, users can show or hide additional information including data, options, or commands. Progressive disclosure promotes simplicity by focusing on the essential, yet revealing additional detail as needed. ...
Chevrons show or hide the remaining items in completely or partially hidden content. Usually the items are shown in place, but they can also be shown in a pop-up menu. When in place, the item stays expanded until the user collapses it. ...
Arrows show a pop-up command menu. The item stays expanded until the user makes a selection or clicks anywhere.
If the arrow button is an independent control, it receives input focus and is activated with the space bar. If the arrow button has a parent control, the parent receives input focus and the arrow is activated with Alt+down arrow and Alt+up arrow keys, as with the drop-down list control. ...
Plus and minus controls expand or collapse to show container content in place when navigating through a hierarchy. The item stays expanded until the user collapses it. Although these look like buttons, their behavior is in-place.
The associated object receives input focus. The plus is activated with the right arrow key, and the minus with the left arrow key. ...
Rotating triangles show or hide additional information in place for an individual item. They are also used to expand containers. The item stays expanded until the user collapses it.
The associated object receives input focus. The collapsed (right-pointing) triangle is activated with the right arrow key, and the expanded (downward-pointing) triangle with the left arrow key. ...
Like chevrons, additional information is shown or hidden in place. The item stays expanded until the user collapses it. Unlike chevrons, the glyphs have a graphical representation of the action, typically with an arrow indicating what will happen. ... Preview arrows are best reserved for situations where a standard chevron doesn't adequately communicate the control's behavior, such as when the disclosure is complex or there is more than one type of disclosure." [msdn.microsoft.com/ en-us/ library/ windows/ desktop/ dn742409%28v=vs.85%29.aspx]
The icons example "Progressive disclosure controls - Vector stencils library" was created using the ConceptDraw PRO diagramming and vector drawing software extended with the Windows 8 User Interface solution from the Software Development area of ConceptDraw Solution Park.
- IVR services diagram | Transport map - Vector stencils library ...
- Logistic Truck Vector Png
- Train Station View Vector Png
- Design elements - Technology | Ict Gadgets Png
- Process Flowchart | Information Technology Architecture | Network ...
- Clipart Financial Position Png
- Watch Vector Png
- Time Vector Png High Quality
- 5 Level pyramid model diagram - Information systems types | Floor ...
- Travel Vector Png
- Indonesia Map Vector Png
- Earphone Vector Png
- Warehouse Vector Png
- Security Vector Png
- Reading Vector Png
- Medical Infographics Png Vector
- Angola Vector Png
- Map symbols - Vector stencils library | How to Draw a Map of North ...
- 4 Level pyramid model diagram - Information systems types | 5 Level ...
- Africa Vector Png

























-epc-diagrams---vector-stencils-library.png--diagram-flowchart-example.png)
-epc-diagrams---vector-stencils-library.png--diagram-flowchart-example.png)
-epc-diagrams---vector-stencils-library.png--diagram-flowchart-example.png)
-epc-diagrams---vector-stencils-library.png--diagram-flowchart-example.png)
-epc-diagrams---vector-stencils-library.png--diagram-flowchart-example.png)
-epc-diagrams---vector-stencils-library.png--diagram-flowchart-example.png)
