HelpDesk
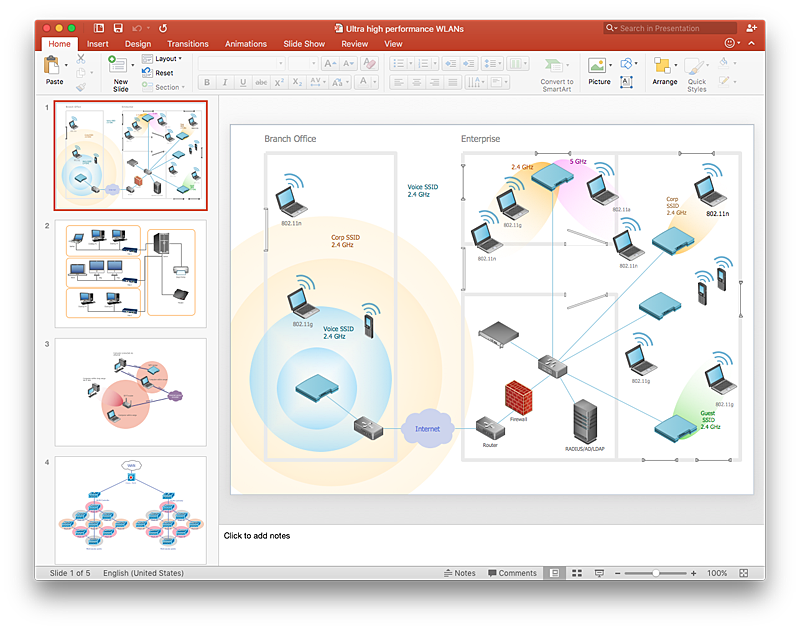
How to Add a Wireless Network Diagram to a PowerPoint Presentation
The PowerPoint presentation of wireless network can be very informative. ConceptDraw PRO allows you to easily create wireless network diagrams and then make a PowerPoint Presentation from your diagrams in a single click.HelpDesk
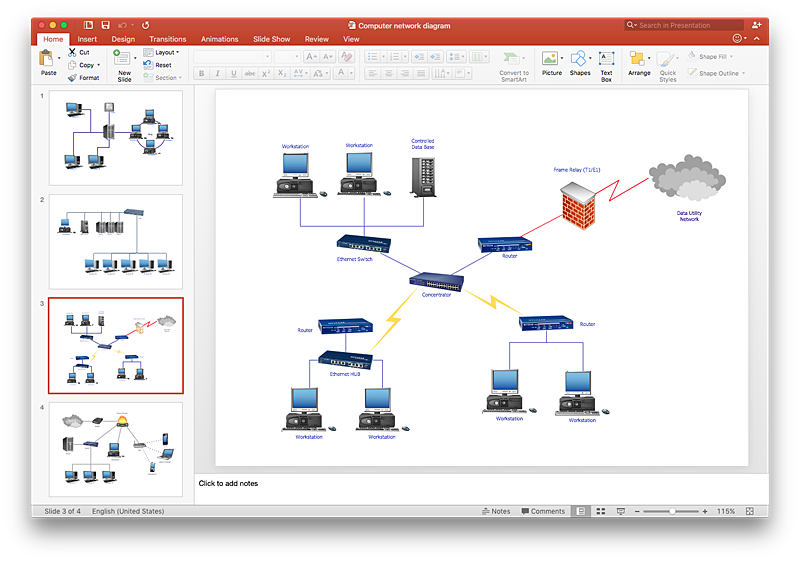
How To Add a Computer Network Diagram to a PowerPoint Presentation
The PowerPoint presentation of computer network can be very informative. ConceptDraw PRO allows you to easily create computer network diagrams and then make a PowerPoint Presentation from your network diagrams in a single click.HelpDesk
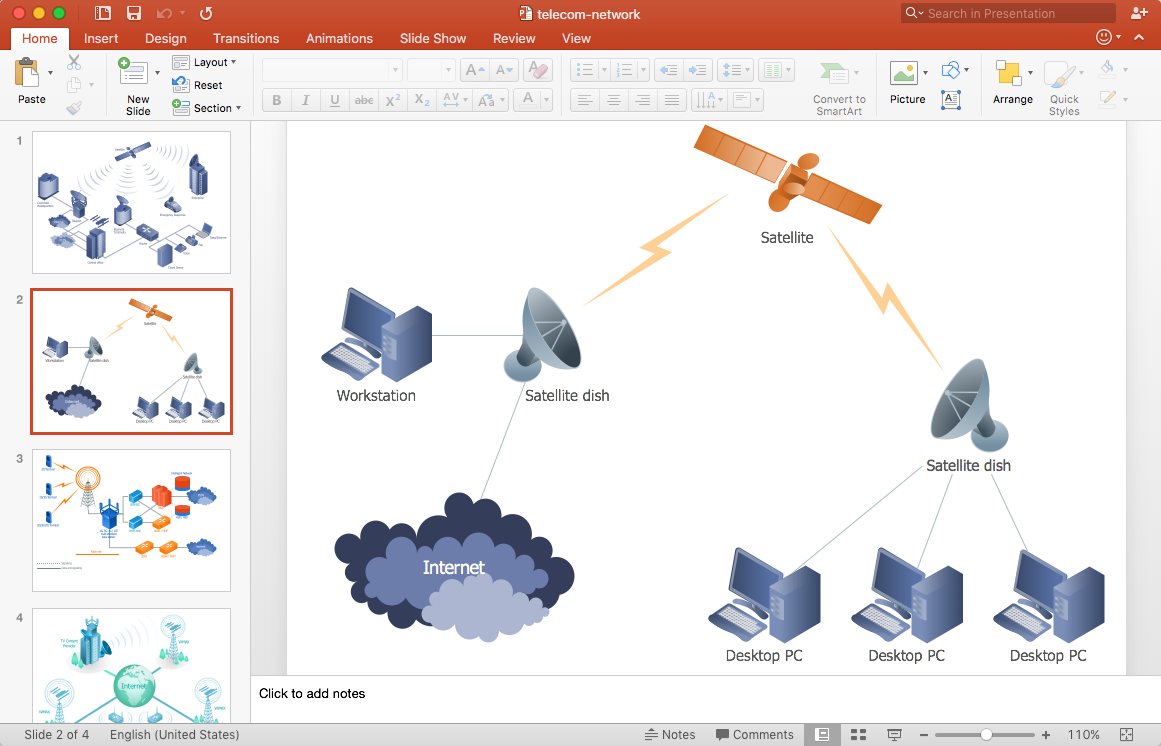
How to Add a Telecommunication Network Diagram to a PowerPoint Presentation
Telecommunication network diagram represents a system consisting of computers, servers, telecommunication devices, switches, satellites, wireless transmitters, antennas, cables, etc., that link a set of remote nodes. It is also describes a telephone exchange, that connects calls between landlines. ConceptDraw PRO allows you to easily create telecommunication network diagrams and then make a PowerPoint Presentation from your network documentation in a few clicks. Telecommunication network diagrams are used to show components and connections in a telecommunications network: how they are interacted between each other and with end-users. The PowerPoint presentation on concept of telecom network can be very informative and helpful. ConceptDraw PRO allows you to make a MS PowerPoint Presentation from your telecommunication network diagrams in a few clicks.HelpDesk
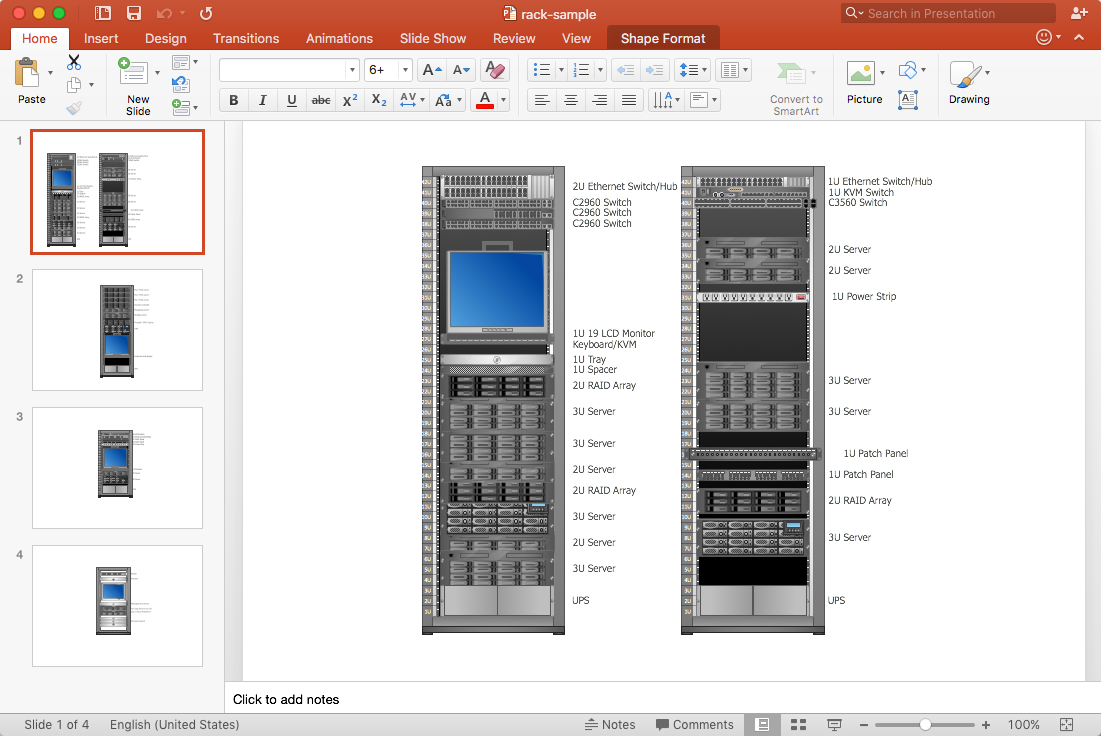
How to Add a Rack Diagram to a PowerPoint Presentation
Rack diagrams are created to make short work of configuring and documenting the server and network equipment of the rack frameworks. Rack diagrams may be useful when considering equipment purchasing, or installing. Using the ConceptDraw Rack Diagrams solution, you can quickly and easily design a rack diagram from the set of vector graphic objects that are fully consistent with accepted industry standards. The Rack diagram will help you when considering and purchasing a rack of network equipment. When installing equipment, a rack diagram will help you to situate equipment quickly and in a due manner. The PowerPoint presentation on concept of your server room rack layouts can be very informative and helpful. ConceptDraw PRO allows you to easily create wireless network diagrams and then make a PowerPoint Presentation from your diagrams in a single click.HelpDesk
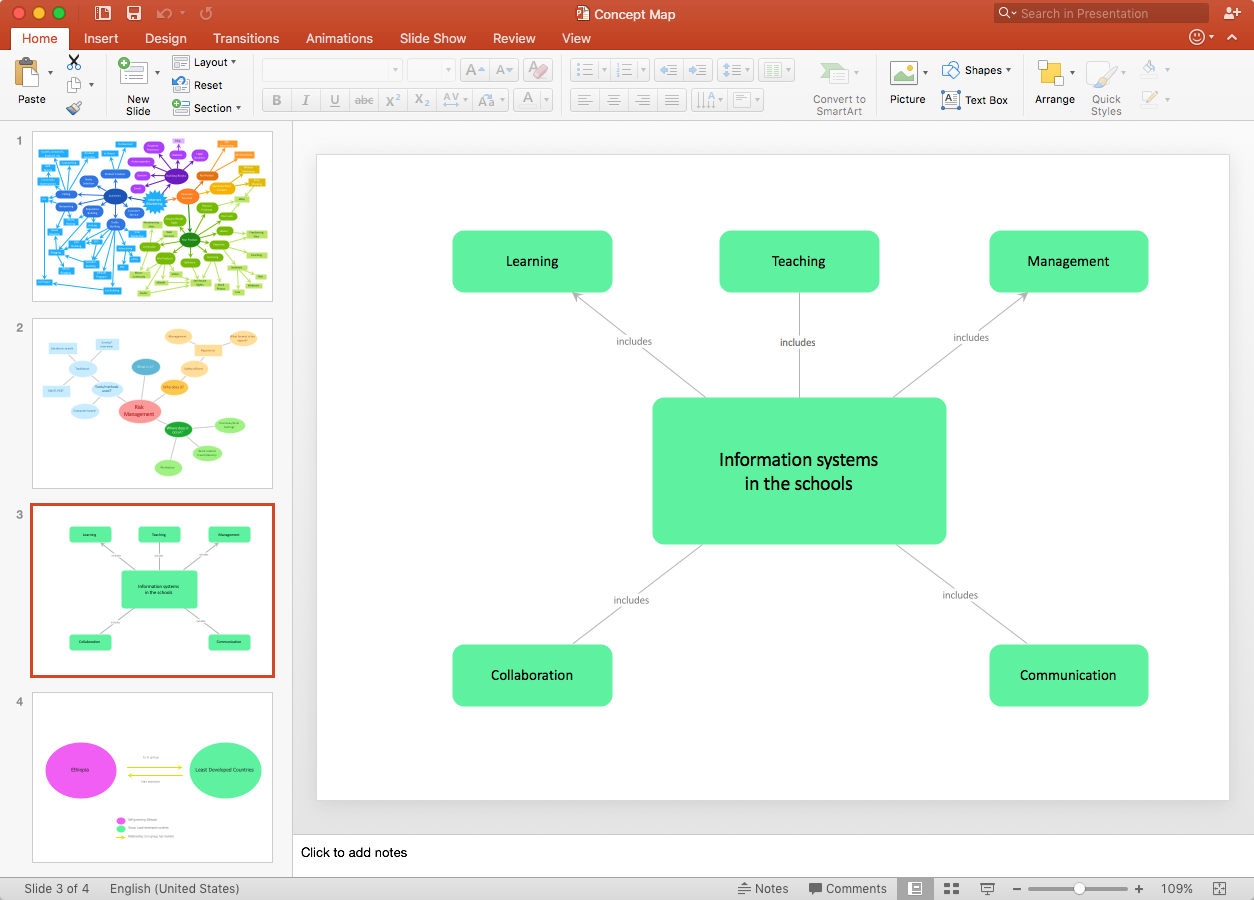
How to Add a Concept Map to a PowerPoint Presentation
Concept maps visually present the relationships among a set of a logically connected items. ConceptDraw PRO allows you to draw concept maps using the Concept Map solution. The PowerPoint presentation of key concept points can be very informative and helpful.
 ConceptDraw Solution Park
ConceptDraw Solution Park collects graphic extensions, examples and learning materials
 Telecommunication Network Diagrams
Telecommunication Network Diagrams solution extends ConceptDraw PRO software with samples, templates, and great collection of vector stencils to help the specialists in a field of networks and telecommunications, as well as other users to create Computer systems networking and Telecommunication network diagrams for various fields, to organize the work of call centers, to design the GPRS networks and GPS navigational systems, mobile, satellite and hybrid communication networks, to construct the mobile TV networks and wireless broadband networks.
Types of Flowcharts
A Flowchart is a graphical representation of process, algorithm, workflow or step-by-step solution of the problem. It shows the steps as boxes of various kinds and connects them by arrows in a defined order depicting a flow. There are twelve main Flowchart types: Basic Flowchart, Business Process Modeling Diagram (BPMN), Cross Functional Flowchart, Data Flow Diagram (DFD), IDEF (Integrated DEFinition) Flowchart, Event-driven Process Chain (EPC) Diagram, Influence Diagram (ID), Swimlane Flowchart, Process Flow Diagram (PFD), Specification and Description Language (SDL) Diagram, Value Stream Mapping, Workflow Diagram. Using the Flowcharts solution from the Diagrams area of ConceptDraw Solution Park you can easy and quickly design a Flowchart of any of these types. This solution offers a lot of special predesigned vector symbols for each of these widely used notations. They will make the drawing process of Flowcharts much easier than ever. Pay also attention for the included collection of ready Flowchart examples, samples and quick-start templates. This is business process improvement tools. If you are looking for MS Visio for your Mac, then you are out of luck, because it hasn't been released yet. However, you can use Visio alternatives that can successfully replace its functions. ConceptDraw PRO is an alternative to MS Visio for Mac that provides powerful features and intuitive user interface for the same.
HelpDesk
How to Make PowerPoint Presentation of Data Driven Infographics
ConceptDraw PRO can be used as a tool for creating data-driven infographics. It allows you to draw data driven using the special templates and vector stencils libraries. ConceptDraw PRO allows you to make a MS PowerPoint Presentation from your Data-driven infographics in a few simple steps.
 Business Package for Management
Package intended for professional who designing and documenting business processes, preparing business reports, plan projects and manage projects, manage organizational changes, prepare operational instructions, supervising specific department of an organization, workout customer service processes and prepare trainings for customer service personal, carry out a variety of duties to organize business workflow.
 Bubble Diagrams
Bubble diagrams have enjoyed great success in software engineering, architecture, economics, medicine, landscape design, scientific and educational process, for ideas organization during brainstorming, for making business illustrations, presentations, planning, design, and strategy development. They are popular because of their simplicity and their powerful visual communication attributes.
 Education Package
Education Package is a comprehensive set of multifarious graphical solutions from ConceptDraw Solution Park, collected together in help to ConceptDraw PRO users working in a field of science, education and training, which is aimed at improving the quality of education and helping to design with ease variety of interesting and colorful educational materials, diagrams, charts and maps. Use it to present the information and knowledge in an interesting, clear, structured and simple form to achieve a success in education and pedagogy, to maintain the interest of students and pupils throughout the whole learning process, at the lectures, lessons and even during independent work with additional materials, to contribute to better perception of scientific information by listeners during the conferences and reports.
 Block Diagrams
Block diagrams solution extends ConceptDraw PRO software with templates, samples and libraries of vector stencils for drawing the block diagrams.
 Management Area
The solutions from Management area of ConceptDraw Solution Park collect templates, samples and libraries of vector stencils for drawing the management diagrams and mind maps.
 Sales Flowcharts
The Sales Flowcharts solution lets you create and display sales process maps, sales process workflows, sales steps, the sales process, and anything else involving sales process management.
- Make A Informative Presentation On Basic Networking Concepts
- Informative Presentation On Basic Networking Concepts Www
- Explain Informative Presentation On Basic Networking Concepts
- Prepare An Informative Presentation On Networking Concepts
- Make An Informative Presentation On Basic Networking Concept
- Informative Presentation Basic Networking Concepts
- Make An Informative Presentation On Basic Networking Concepts
- Www Presentation Onbasic Networking Concepts Com
- Make A Full Informative Presentation On Networking Concept
- An Informative Powerpoint Presentation On Basic Networking
- Informative Presentation On Basic Networking Concept
- Informative Ppt Presentation On Networking Concepts
- How To Make Powerpoint Presentation On Networking Concepts
- Project Make Informative Presentations On Networking Concepts
- Make An Informative Images On Basic Networking Concept
- Make An Information Presentation Basic Networking Concept
- Chart Presentation On Basic Networking Concepts
- Make An Information Presentation On Basic Networking Concept
- How To Make A Informative Presentation On Basic Networking ...
