Use Case Diagrams technology with ConceptDraw PRO
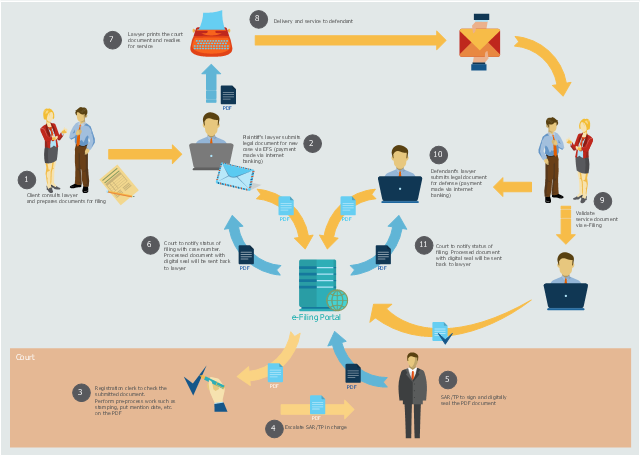
Use case diagrams are used at the development of software and systems for definition of functional system requirements or system of systems. Use case diagram presents the consecution of object’s actions (user’s or system’s) which are executed for reaching the definite result.This workflow diagram example was created on the base of picture "Online submission" from the e-Filing Portal of the Malaysian Judiciary. [efiling.kehakiman.gov.my/ eFiling/ img/ efiling_ general_ workflow.jpg]
"The e-Filing Portal is an initiative of the Malaysian Judiciary and has been designed to serve as a one-stop portal for the legal community to gain access to all its needs ranging from registration of cases, filing of case documents, retrieval of service document right down to searching of case files and information including case schedules.
Previously lawyers have to call the registrar for the status of their case filing. Now the e-Filing portal will send notification of any case filing status to the lawyers' email immediately upon successful registration in the e-Filing System." [efiling.kehakiman.gov.my/ eFiling]
The flowchart example "E-Filing general workflow" was created using the ConceptDraw PRO diagramming and vector drawing software extended with the Sales Flowcharts solution from the Marketing area of ConceptDraw Solution Park.
 Rapid UML
Rapid UML solution extends ConceptDraw PRO software with templates, samples and libraries of vector stencils for quick drawing the UML diagrams using Rapid Draw technology.
 Sales Flowcharts
The Sales Flowcharts solution lets you create and display sales process maps, sales process workflows, sales steps, the sales process, and anything else involving sales process management.
HelpDesk
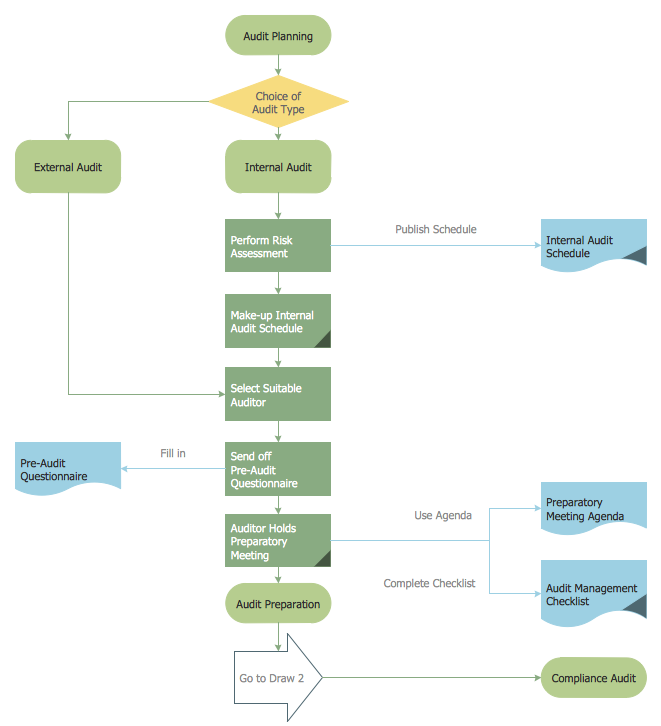
How to Create an Audit Flowchart Using ConceptDraw PRO
Audit flowcharts are often used in auditors activity. This is the most effective way of preparation and documentation of the audit process. Financial audit process has a clear structure, and therefore audit flowchart is often used to denote an audit process. This is the most effective way of preparation and documentation of the audit process. Flowcharts are often used in auditors activity. A flowchart may be created at any stage of an audit process as an aid in the determination and evaluation of a client's accounting system. ConceptDraw PRO allows you to create professional accounting flowchart quickly using the professional Audit Flowcharts solution.- UML object diagram - Safety inspection | Diagramming Software for ...
- TQM diagrams - Vector stencils library | TQM diagram - Template ...
- Process Flowchart | Data Flow Diagram Model | Manufacturing 8 Ms ...
- Process Flowchart | Identifying Quality Management System ...
- Basic Flowchart Symbols and Meaning | TQM diagrams - Vector ...
- UML timing diagram - Inspection | Resources and TEAF Work ...
- The Symbol For Inspections In Process Chart Is Given By Image
- TQM Diagram Example | Definition TQM Diagram | Create TQM ...
- Process Flowchart | Basic Flowchart Symbols and Meaning | Flow ...
- Basic Flowchart Symbols and Meaning | Process Flowchart | Value ...
- Process Flowchart | Probability Quality Control Tools | Basic ...
- Diagram Of Production System
- Total Quality Management Value | Seven Basic Tools of Quality ...
- Production System Model With Diagram
- Basic Flowchart Symbols and Meaning | Cross-Functional Flowchart ...
- Context Diagram Template | 5-Set Venn diagram - Template ...
- Sales Process Flowchart. Flowchart Examples | Basic Flowchart ...
- Fishbone diagram - Production process
- UML Use Case Diagram Example Registration System
- Process Flowchart | Basic Flowchart Symbols and Meaning | Flow ...


