HelpDesk
How to Draw a Process Flow Diagram in ConceptDraw PRO
Process Flow diagrams are used in chemical and process engineering to show the flow of chemicals and the equipment involved in the process. When it comes to creating a process flow diagram, it's important to use software that is capable of describing a wide range of processes, using techniques and graphical notation that are easily recognized by engineering workers. An ideal drawing platform will utilize functions that can cope with the output of a high volume of engineering processes, that may change rapidly from development to implementation stages. ConceptDraw PRO, with the extended functionality of the Chemical and Process Engineering Diagrams solution, is the ideal medium for creating designs of this type. The Chemical and Process Engineering Diagrams solution complements this feature with a library of selected icons to represent various steps — all instantly recognizable and applicable to a wide user base. ConceptDraw PRO allows you to draw the Process Flow diagram easily using the set of special libraries.
 Chemical and Process Engineering
This chemical engineering solution extends ConceptDraw PRO v.9.5 (or later) with process flow diagram symbols, samples, process diagrams templates and libraries of design elements for creating process and instrumentation diagrams, block flow diagrams (BFD
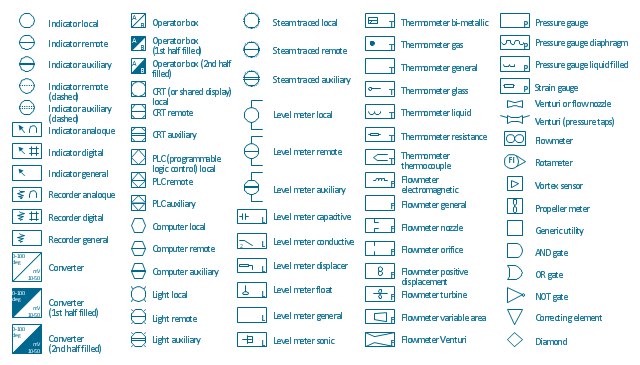
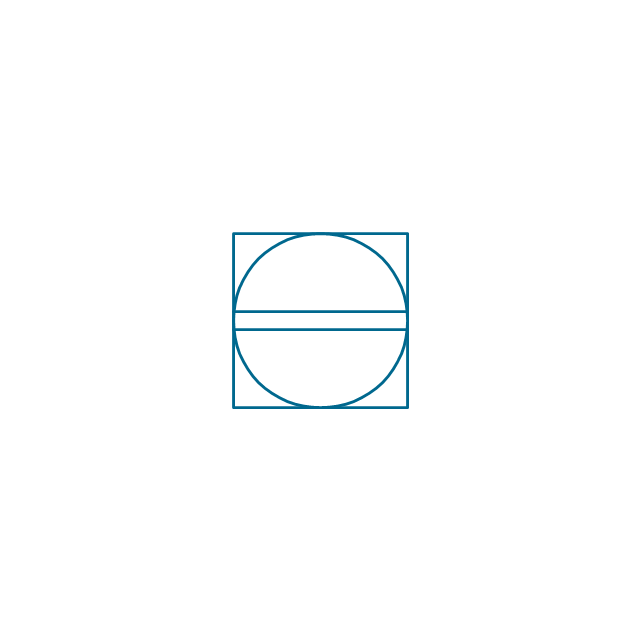
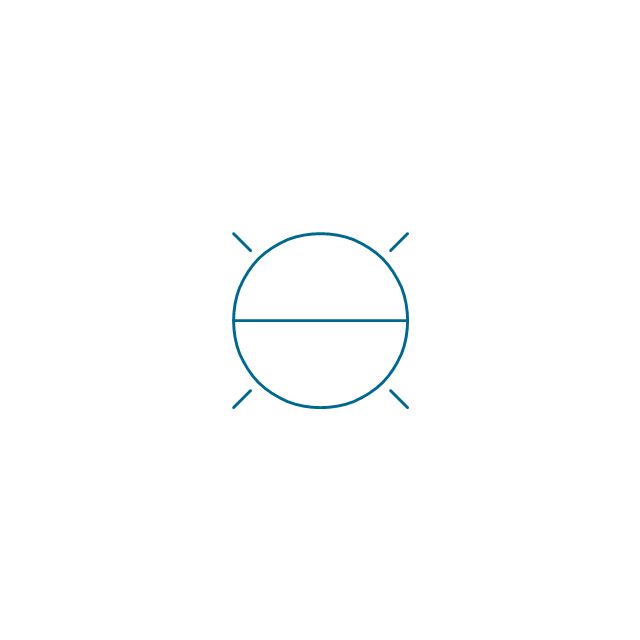
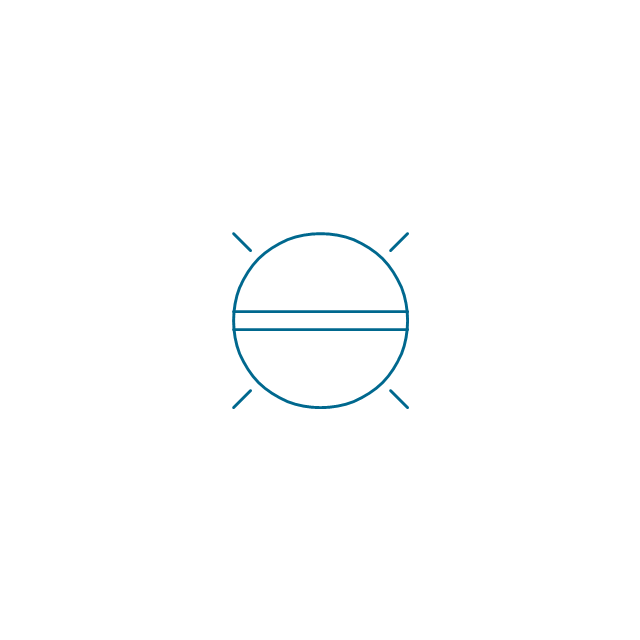
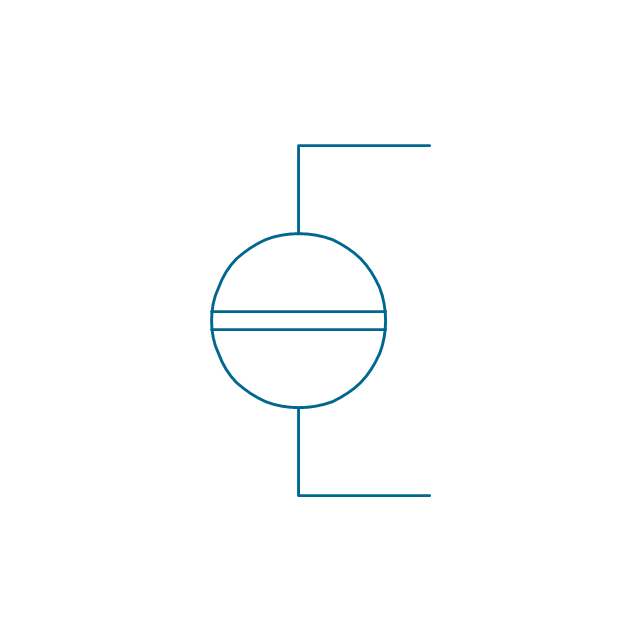
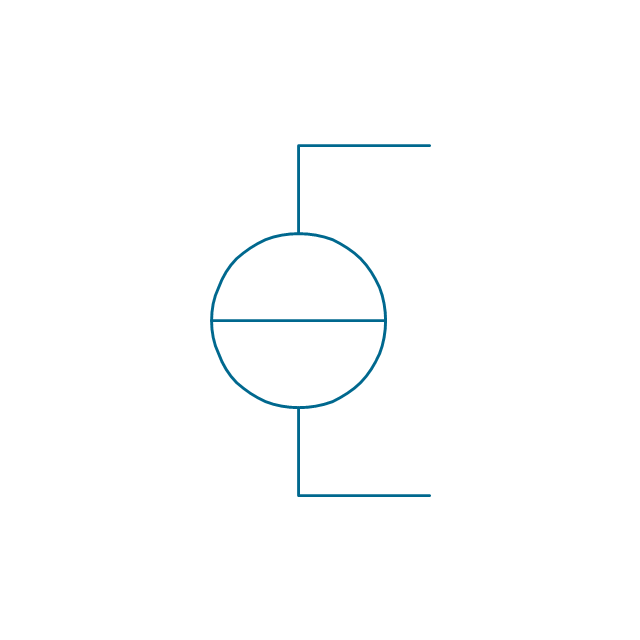
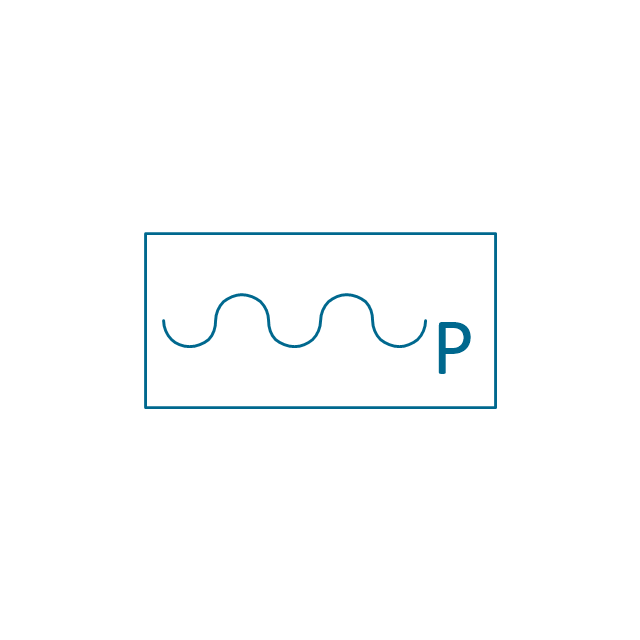
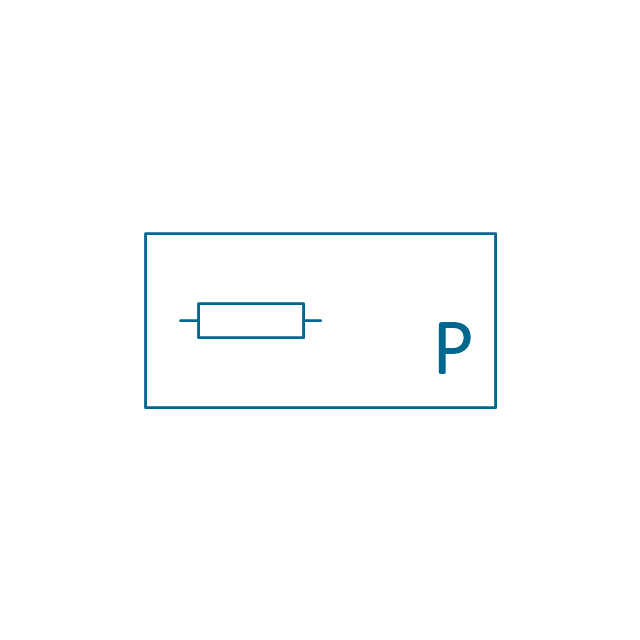
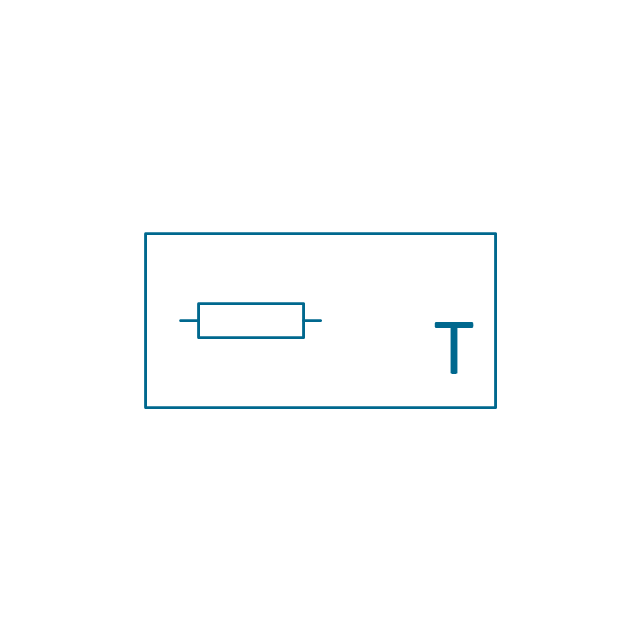
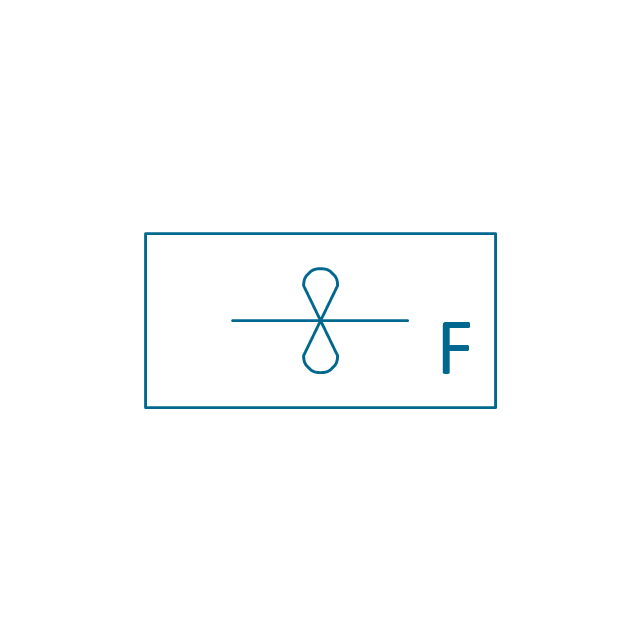
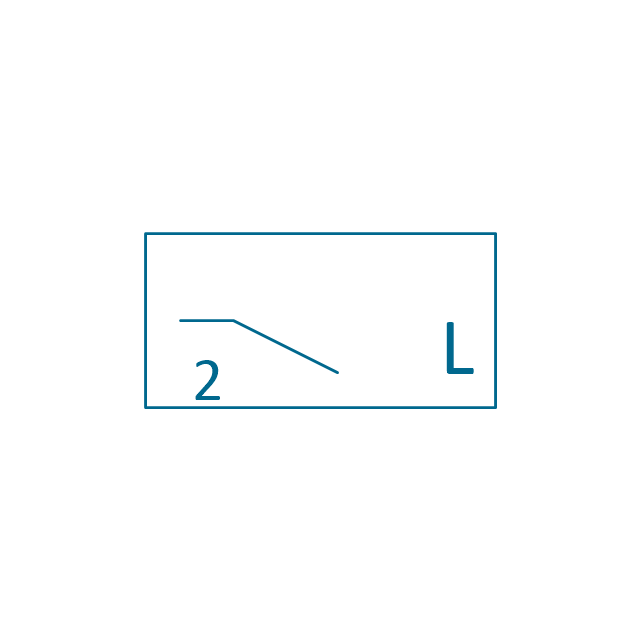
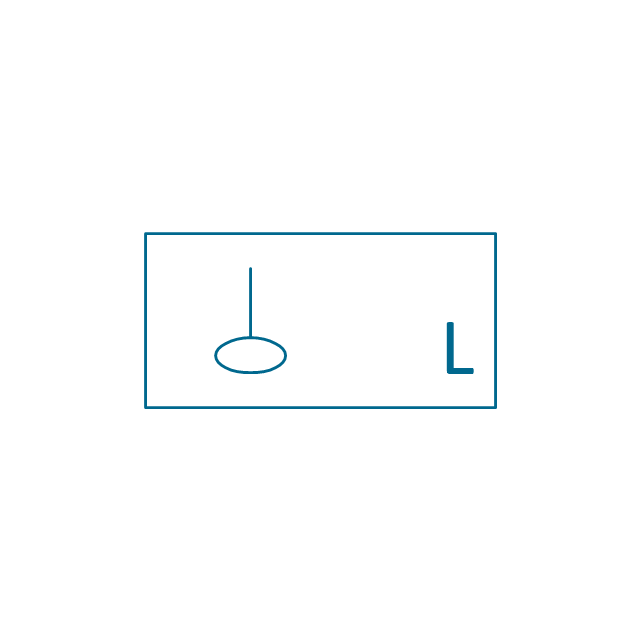
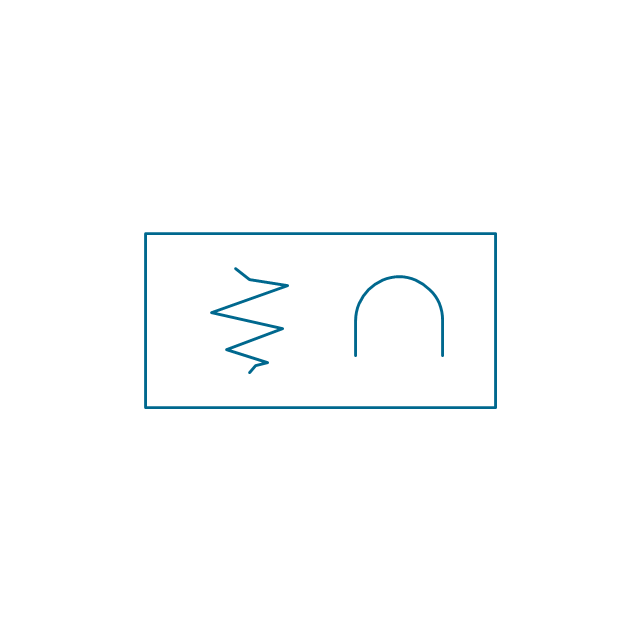
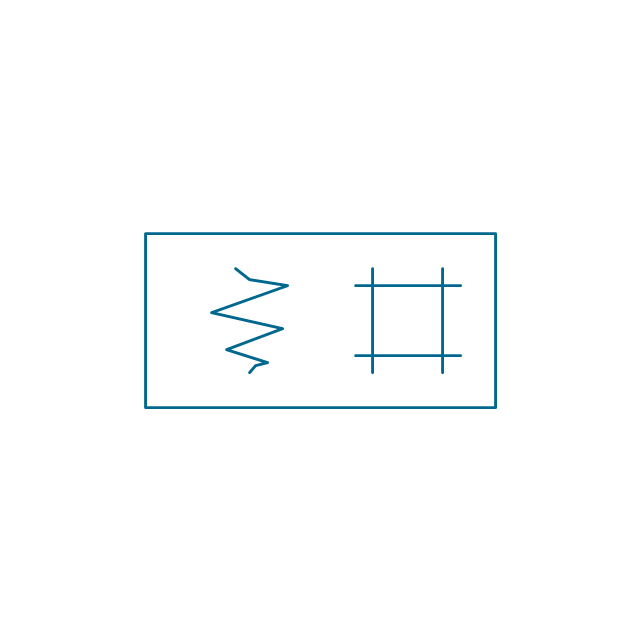
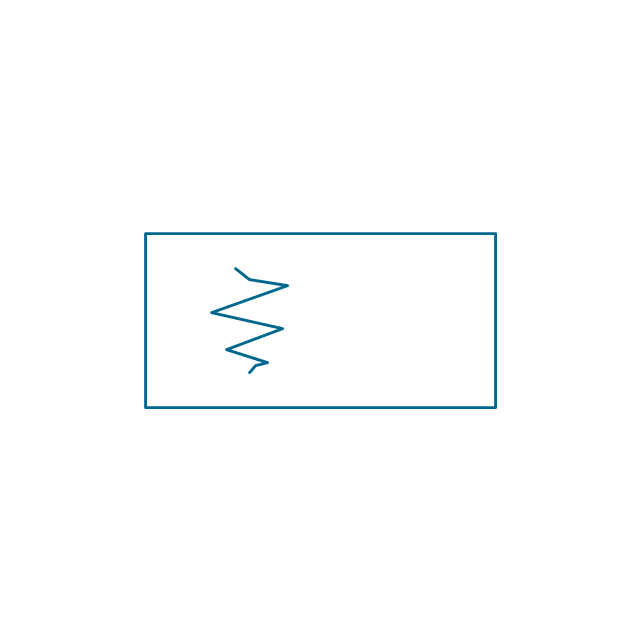
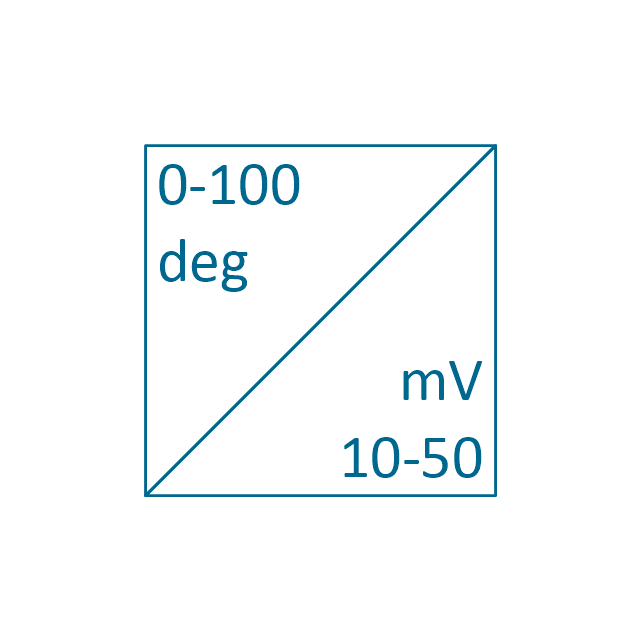
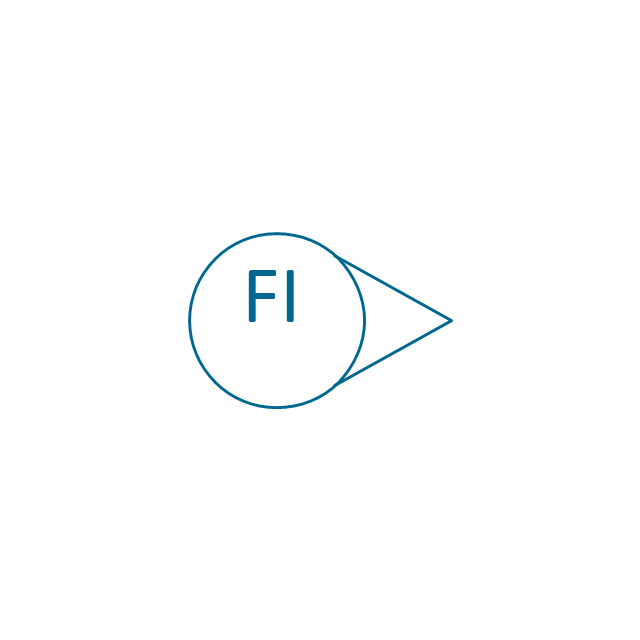
The vector stencils library "Instruments" contains 72 symbols of control instruments and measuring devices: meters and gauges, and callouts, text boxes, and inserts.
Use these shapes to create annotated process flow diagrams (PFD), flow control, manufacturing processes, and distribution system diagrams.
"Process control is an engineering discipline that deals with architectures, mechanisms and algorithms for maintaining the output of a specific process within a desired range.
Process control is extensively used in industry and enables mass production of continuous processes such as oil refining, paper manufacturing, chemicals, power plants and many other industries. Process control enables automation, with which a small staff of operating personnel can operate a complex process from a central control room." [Process control. Wikipedia]
The example "Design elements - Instruments" was created using the ConceptDraw PRO diagramming and vector drawing software extended with the Chemical and Process Engineering solution from the Engineering area of ConceptDraw Solution Park.
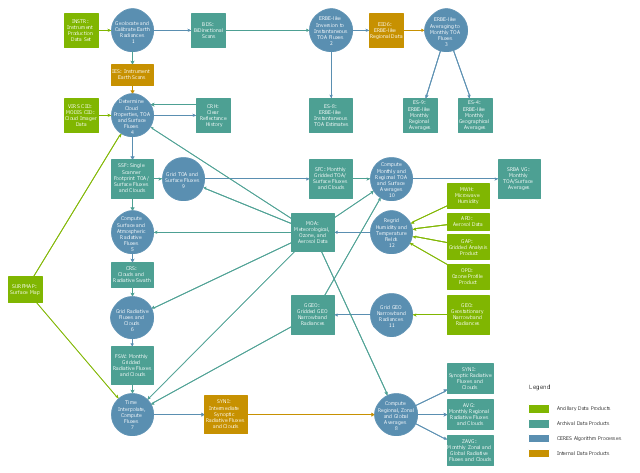
This DFD sample was created on the base of the figure from the NASA website. [asd-www.larc.nasa.gov/ ATBD/ DFD.html]
"Clouds and the Earth's Radiant Energy System (CERES).
EOS-Terra: Understanding Earth's Clouds and Climate.
The Clouds and the Earth's Radiant Energy System (CERES) instrument is one of several that will be flown aboard the Earth Observing System's Terra spacecraft, scheduled for launch in late1999. The data from the CERES instrument will be used to study the energy exchanged between the Sun; the Earth's atmosphere, surface and clouds; and outer space.
The CERES EOS-Terra instrument will be the second CERES instrument in Earth orbit. The first CERES instrument is currently orbiting the Earth aboard the Tropical Rainfall Measuring Mission observatory, which was launched in November 1997. Early results of the TRMM mission show that the first CERES has provided better measurement capabilities than any previous satellite instrument of its kind.
What CERES Will Measure.
CERES will measure the energy at the top of the atmosphere, as well as estimate energy levels in the atmosphere and at the Earth's surface. Using information from very high resolution cloud imaging instruments on the same spacecraft, CERES also will determine cloud properties, including cloud amount, altitude, thickness, and the size of the cloud particles. All of these measurements are critical for advancing our understanding of the Earth's total climate system and further improving climate prediction models.
The CERES instrument is based on NASA Langley's highly successful Earth Radiation Budget Experiment (ERBE) which used three satellites to provide global energy budget measurements from 1984 to 1990." [nasa.gov/ centers/ langley/ news/ factsheets/ CERES.html]
The DFD example "CERES data flow diagram" was created using the ConceptDraw PRO diagramming and vector drawing software extended with the Data Flow Diagrams solution from the Software Development area of ConceptDraw Solution Park.
The vector stencils library "Instruments" contains 72 symbols of control instruments and measuring devices: meters and gauges, and callouts, text boxes, and inserts.
Use these shapes to create annotated process flow diagrams (PFD), flow control, manufacturing processes, and distribution system diagrams in the ConceptDraw PRO software extended with the Chemical and Process Engineering solution from the Chemical and Process Engineering area of ConceptDraw Solution Park.
www.conceptdraw.com/ solution-park/ engineering-chemical-process
Business Process Elements: Activities
Create professional business process diagrams using ConceptDraw Activities library with 34 objects from BPMN.
- Process Flow Diagram Symbols | Piping and Instrumentation ...
- Process Flowchart | Process Flow Diagram Symbols | Instruments ...
- Process Flow Diagram Symbols | Process Flowchart | Chemical ...
- Process Flow Diagram Symbols | Process Flowchart | Chemical ...
- Process Flowchart | Process Flow Diagram Symbols | Rack ...
- Process Flowchart | Piping and Instrumentation Diagram Software ...
- Process Flowchart | Process Flow Diagram Symbols | Process ...
- Process Flow Diagram Symbols | Electrical Symbols, Electrical ...
- Process Flow Diagram Symbols | Process Flowchart | Design ...
- Process Flowchart | Process and Instrumentation Diagram | Process ...
- Process Flow Chart | Process Flow Diagram | Design elements ...
- Electrical Symbols, Electrical Diagram Symbols | Process Flowchart ...
- Process Flow Diagram Symbols | Piping and Instrumentation ...
- Process flow diagram - Typical oil refinery | Crude oil distillation unit ...
- Piping and Instrumentation Diagram Software | Process Flowchart ...
- Design elements - Instruments | Piping and Instrumentation Diagram ...
- Process Flow Diagram Symbols | Process Engineering | Diagrams ...
- Mechanical Drawing Symbols | Process Flow Diagram Symbols ...
- How to Draw a Chemical Process Flow Diagram
- Process Flow Diagram Symbols | Process and Instrumentation ...







-instruments---vector-stencils-library.png--diagram-flowchart-example.png)
-instruments---vector-stencils-library.png--diagram-flowchart-example.png)

























-instruments---vector-stencils-library.png--diagram-flowchart-example.png)
-instruments---vector-stencils-library.png--diagram-flowchart-example.png)

-instruments---vector-stencils-library.png--diagram-flowchart-example.png)





-instruments---vector-stencils-library.png--diagram-flowchart-example.png)
-instruments---vector-stencils-library.png--diagram-flowchart-example.png)

