Local area network (LAN). Computer and Network Examples
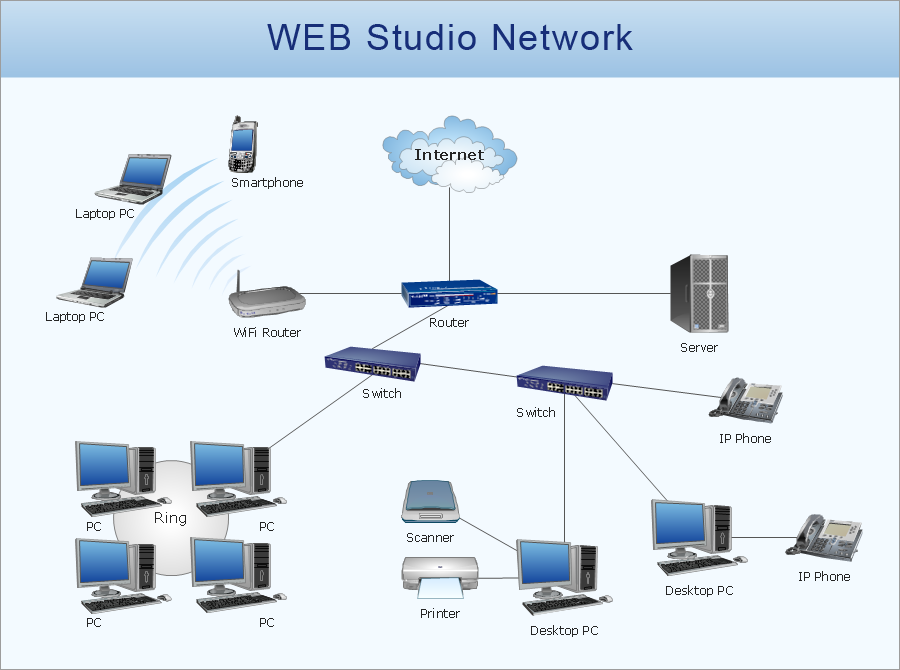
Local Area Network (LAN) is a network which consists of computers and peripheral devices connected each other and to the local domain server, and covers a little territory or small number of buildings, such as home, school, laboratory, office, etc. LAN serves for few hundreds of users. It includes many cables and wires, and demands to design previously a Network diagram. All local area network devices can use the shared printers and disk storage. ConceptDraw PRO is a perfect network diagramming software with examples of LAN Diagrams, templates and predesigned vector objects. ConceptDraw PRO is the ideal choice for network engineers and network designers who need to draw fast and easy Local Area Network Diagrams, for IT specialists, developers and other IT professionals which need to visualize the communication schemes of LAN and visually document the LAN's physical structure and arrangement in houses, offices and other buildings. Ready-to-use vector objects from Computer Network Diagrams solution will help you design LAN diagrams in minutes.
Electrical Symbols, Electrical Diagram Symbols
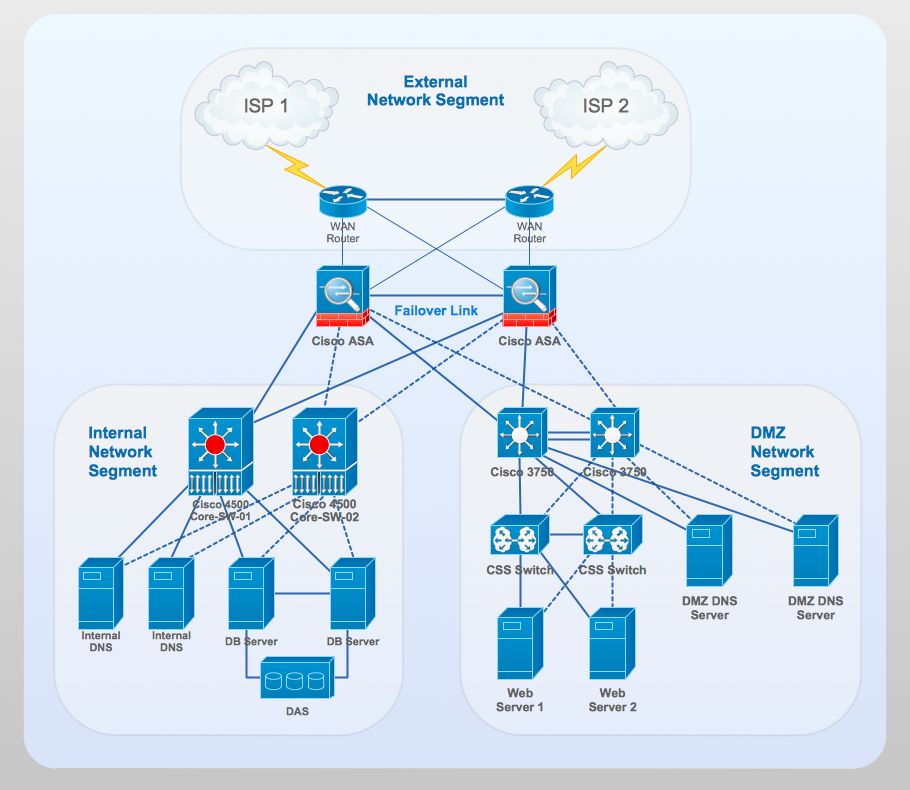
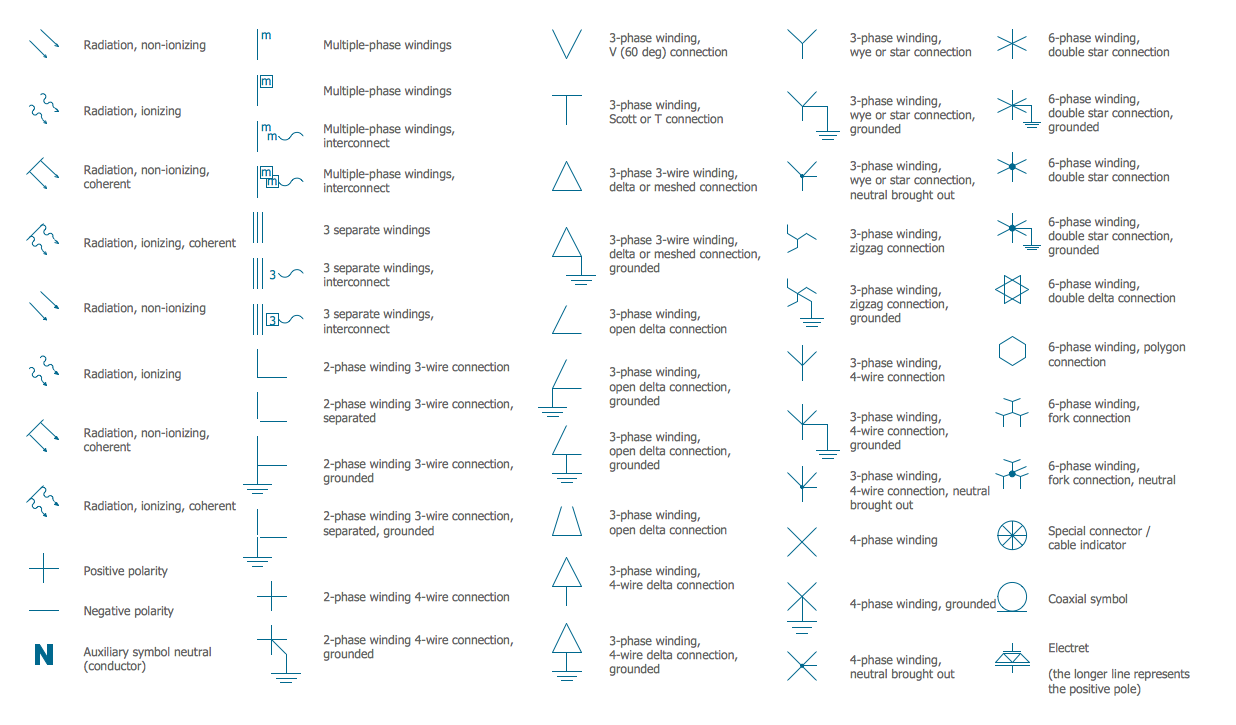
When drawing Electrical Schematics, Electrical Circuit Diagrams, Power Systems Diagrams, Circuit and Wiring Diagrams, Digital and Analog Logic Schemes, you will obligatory need the electrical symbols and pictograms to represent various electrical and electronic devices, such as resistors, wires, transistors, inductors, batteries, switches, lamps, readouts, amplifiers, repeaters, relays, transmission paths, semiconductors, generators, and many more. Today these symbols are internationally standardized, so the diagrams designed using them are recognizable and comprehensible by specialists from different countries. Electrical Engineering Solution included to ConceptDraw Solution Park provides 26 libraries with 926 commonly used electrical schematic and electrical engineering symbols making the reality the easy drawing of Electrical diagrams, schematics and blueprints. Now you need only a few minutes to create great-looking Electrical diagram, simply choose required electrical design elements from the libraries, drag them on the needed places at the document and connect in a suitable way.Network Gateway Router
Special libraries of highly detailed, accurate shapes and computer graphics, servers, hubs, switches, printers, mainframes, face plates, routers etc.
Electrical Symbols — Qualifying
A qualifying symbol is graphics or text added to the basic outline of a device’s logic symbol to describe the physical or logical characteristics of the device. 26 libraries of the Electrical Engineering Solution of ConceptDraw PRO make your electrical diagramming simple, efficient, and effective. You can simply and quickly drop the ready-to-use objects from libraries into your document to create the electrical diagram.SDL Flowchart Symbols
Drawing the diagrams we try to find in help the powerful software and now we have the ConceptDraw PRO. The ability easily create the SDL diagrams is made possible thanks to unique Specification and Description Language (SDL) Solution from the Industrial Engineering Area of ConceptDraw Solution Park. This solution extends ConceptDraw PRO 2 libraries - SDL Connectors and SDL Diagrams that contain 70 predesigned SDL flowchart symbols.Internet Connectivity. Computer and Network Examples
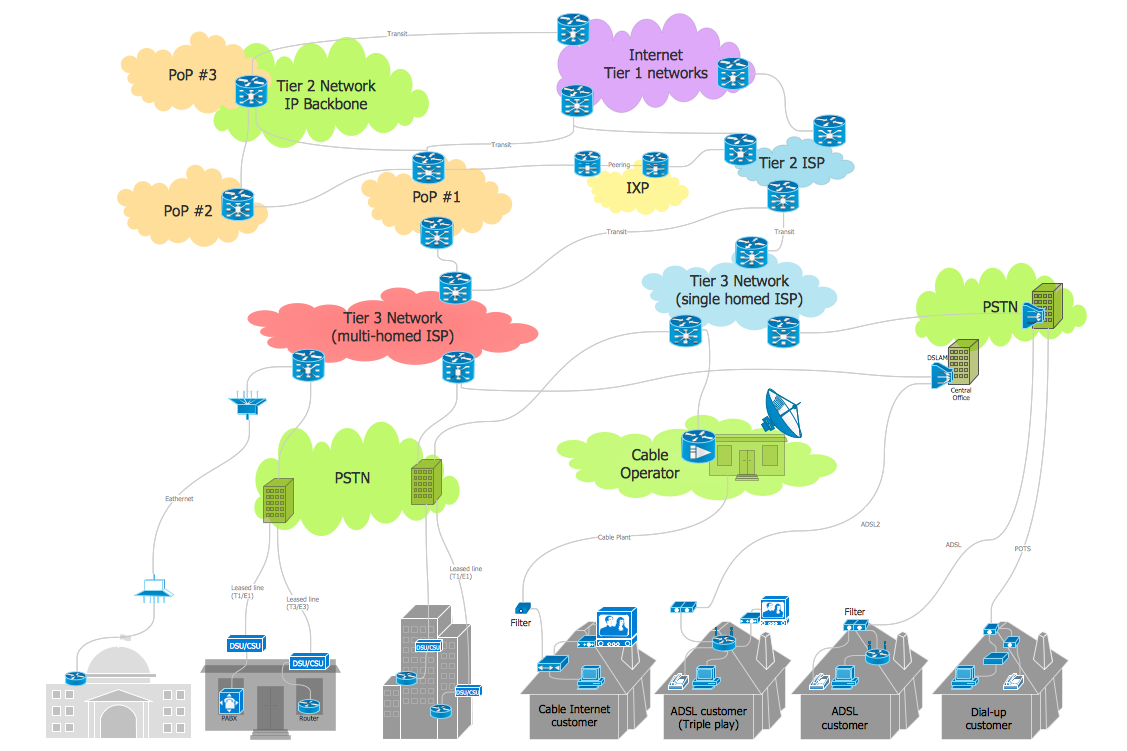
The Internet Connectivity of the computers, mobile devices, computer networks to the Internet enables the users to access the various Internet services. There are many ways and technologies of the connection to the Internet with different data signaling rates: Wireless, Ethernet cable, Optical fiber, Dial-up, DSL, broadband Internet access, etc. This example was created in ConceptDraw PRO using the Computer and Networks solution from the Computer and Networks area of ConceptDraw Solution Park and shows how the customers connect to ISPs and ISPs connect between the tiers (peering and transit).
Hybrid Network Topology
A network topology is the topological structure or the arrangement of different elements of computer network. There are several basic types of network topologies, such as star, ring, bus, mesh. But the most popular is a combination of two or more diverse basic network topologies, which is known as hybrid network topology. The examples of hybrid topology are: star-bus, star-ring topologies, etc. Each resulting hybrid topology has its own features, advantages and limitations of its components. Hybrid network topologies are more flexible, reliable, and have increased fault tolerance, the faults in them can be easily diagnosed and corrected, new nodes can be easily added. But at the same time hybrid topologies often are sufficiently expensive and difficult for managing. ConceptDraw PRO diagramming and vector drawing software supplied with the tools of Computer Network Diagrams solution from Computer and Networks area is perfect for schematic description various types of computer network topologies and easy designing Hybrid network topology diagrams.Network Diagram Software (PRO)
Network Diagrams are used to visually represent the network architecture, to illustrate the network structure, how the computers and other elements of the network are connected each other using a variety of network symbols, clipart and connection lines. They are incredibly useful on the stages of projecting computer network, of its construction and exploitation. Professionally designed and accurate Network Diagrams are equally convenient for computer engineers and users. You can construct them by hand on the paper or use special network diagramming software, such as ConceptDraw PRO. Having at disposal the powerful network diagramming tools of Computer Network Diagrams solution included to ConceptDraw Solution Park, you can succeed in drawing various types of Computer Network Diagrams, among them Network Communication Plans, Logical Network Diagrams, Network Topology Diagrams, LAN and WAN Diagrams, Network Floor Plan Layouts, Computer Network System Diagrams, Web-based Network Diagrams, Wireless Network Diagrams, Cisco Network Diagram, and others.
IDEF0 standard with ConceptDraw PRO
The activity of any organization is more or less branchy network of processes. The description of these processes is a hard technical task which requires definite methodology and standards. According to the IDEF0 standard any process can be described in the form of a block (Activity Box) which has inputs and outputs. The process consists in transformation of inputs into outputs under the influence of the management and in the presence of necessary resources. Outputs of the given process later on can be either inputs for the next process or resources, or management means.Business Process Flowchart Symbols
Business process modeling is known in the corporate world as an excellent tool which can speak. Business process flowcharts, diagrams and maps are used to define the business processes in terms of inputs and outputs, to visually represent and effectively explain complex business processes of an enterprise, and also showcase decisions on a single piece of paper. The process of business process mapping supposes the use of special business process flowchart symbols predefined by Business Process Modeling Notation (BPMN) and taking their roots from the data processing diagrams and programming flow charts. In other words the BPMN standard notation is a common language used for business process design and implementation, that guarantees a clarity of designed Business Process Flowcharts for all business analysts, technical developers and business managers. The ability to create professionally-looking Business Process flowcharts, maps and diagrams, is provided by powerful ConceptDraw PRO software and the Business Process Mapping solution included to ConceptDraw Solution Park.Cross-Functional Flowchart
Use of Cross-Functional Flowchart is a clear way of showing each team member’s responsibilities and how processes get shared or transferred between different responsible people, teams and departments. Use the best flowchart maker ConceptDraw PRO with a range of standardized cross-functional flowchart symbols to create the Cross-Functional Flowcharts simply and to visualize the relationship between a business process and the functional units responsible for that process. To draw the most quickly Cross-Functional Flowcharts, Cross Functional Process Maps, or Cross Functional Process Flow Diagrams, start with a Cross-functional flowchart samples and templates from ConceptDraw Solution Park. The ConceptDraw Arrows10 and RapidDraw technologies will be also useful for you in drawing. ConceptDraw PRO supports designing both types - horizontal and vertical Cross-functional flowcharts. A vertical layout makes the accents mainly on the functional units while a horizontal layout - on the process. If you need a Visio alternative in Mac OS X, try ConceptDraw PRO. Its interface is very intuitive and it’s actually much easier to use than Visio, yet somehow it’s just as powerful if not more so. ConceptDraw PRO performs professional quality work and seamless Visio interaction.
Technical Drawing Software
Technical drawing or draft is a form of specialized graphic communication, exchange of ideas in industry and engineering. It is a visual representation of object with indication of dimensions and used material, constructed with maintaining the proportions between its parts. Technical drawings are constructed by architects, technologists, engineers, designers, drafters, and other technical professionals according to defined rules, specifications, internationally accepted standards and standardized notations allowing to make unambiguous, clear and understandable technical drawings. ConceptDraw PRO extended with Electrical Engineering solution, Mechanical Engineering solution, Chemical and Process Engineering solution from Industrial Engineering Area of ConceptDraw Solution Park is ideal technical drawing software. Its powerful drawing tools, predesigned vector objects, templates, samples are helpful for creation all kinds of Technical Drawings and Technical Diagrams, Electrical and Mechanical Schematics, Circuit and Wiring Diagrams, Structural Drawings, and many other.Workflow Diagram Examples
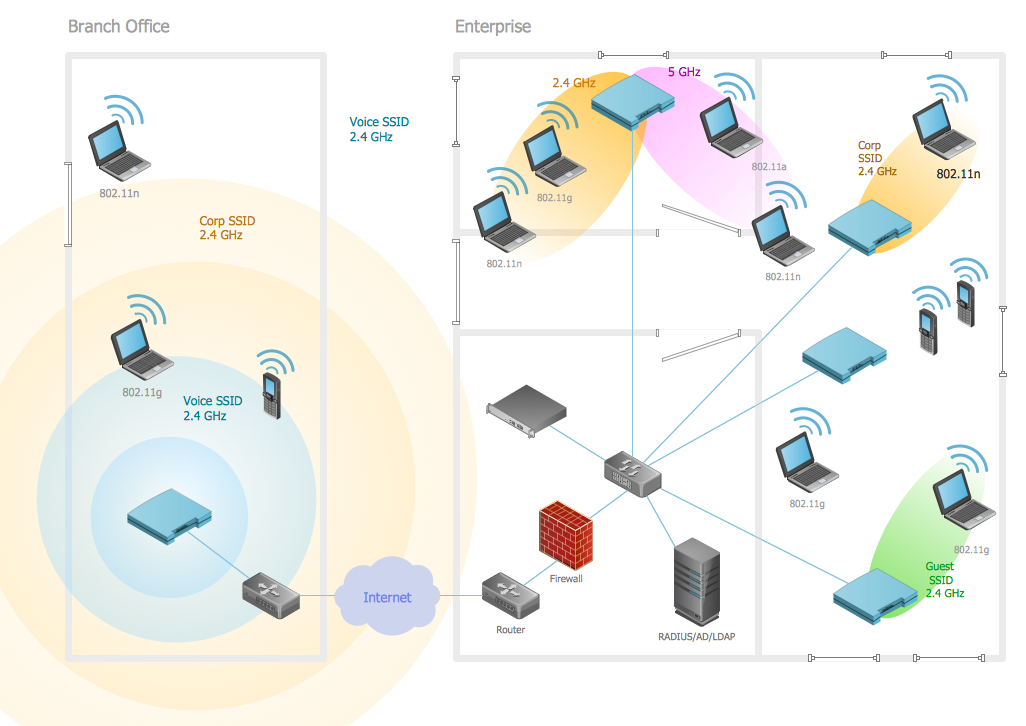
ConceptDraw PRO software extended with the Workflow Diagram solution provides a complete set of samples, templates and features help you to draw diagrams faster. A workflow diagram software you use for drawing workflow diagrams and business process flow diagrams should provide a wide set of examples allows you get closer with workflow diagrams, learn symbols meaning, find appropriate layout and design, and then start drawing your own workflow diagram masterfully. Workflow diagrams used for orchestrating organizational processes between company departments and humans, so critical process diagrams used to train many people to interact must be clear and professional to convey an idea from a view. Thats a reason we created a lot workflow symbols and workflow icons collected them into special Workflow Diagram solution in ConceptDraw Solution Park.Wireless Networking
Wireless networking is useful visual tool for identification of all required equipment, and calculation the cost of creating or updating wireless computer networks. ConceptDraw PRO extended with Wireless Networks Solution from the Computer and Networks Area is the best wireless network diagramming software.The Best Mac Software for Diagramming or Drawing
ConceptDraw PRO is a powerful intelligent vector graphics engine that can be used to create basic diagrams including flowcharts, charts, workflows, flowcharts, organizational charts, business diagram, learn business diagrams, flow diagrams.
- Computer and Network Examples | Netwprk Device Symbols
- Technical Drawing Software | Electrical Symbols , Electrical Diagram ...
- Electrical Symbols — Qualifying | Technical Drawing Software ...
- Circuits and Logic Diagram Software | Electrical Drawing Software ...
- Cisco Network Topology. Cisco icons, shapes, stencils and symbols ...
- Networking Symbol
- Logical network topology diagram | Network Gateway Router | Star ...
- Electrical Symbols , Electrical Diagram Symbols | Bar Diagrams for ...
- Electrical Drawing Software and Electrical Symbols | Electrical ...
- Electrical Symbols , Electrical Diagram Symbols | Process Flowchart ...
- Electrical Symbols , Electrical Diagram Symbols | How To use House ...
- Circuits and Logic Diagram Software | Electrical Drawing Software ...
- Circuits and Logic Diagram Software | Electrical Drawing Software ...
- How to Draw a Computer Network Diagrams | Electrical Symbols ...
- 3D Network Diagram Software
- Local area network ( LAN ). Computer and Network Examples ...
- How To use House Electrical Plan Software | Electrical Symbols ...
- Standard Network Diagram Symbols
- How to Draw a Computer Network Diagrams | Network VOIP ...


